Charting for beginner investors: does technical analysis really work?
Technical analyst Nicole Elliott explains why reading charts is a skill worth learning.
1st December 2020 10:02
by Nicole Elliott from interactive investor
In the sixth and final part of her introduction to technical analysis, Nicole Elliott explains why reading charts is a skill worth learning.

Does technical analysis really work? I’m probably not the best person to ask as I’ve penned this series of six articles on the subject. What I can say though is that for nearly 40 years I have made a decent living using the technique – because I’m worth it!
Trading financial products for large commercial banks (who admittedly have deep pockets), to advising investment and hedge funds as to the choice, scale and timing of their activities, to sorting out my own personal investments, I’ve experienced the subject from all sides. Now I’m a specialist financial writer with experience in major media publications and TV stations.
- Why reading charts can help you become a better investor
- Charting for beginner investors: candlesticks and how to use them
Let’s turn the question on its head: what doesn’t work when investing? The concept of ‘mean reversion’ for start. Beloved by economists, the idea posits that while asset prices and economic data series may deviate from some sort of natural average value, when they get out of kilter they will eventually be dragged back to the long term mean.
Look at the attached chart of the US Nasdaq index and tell me, hand on heart, there’s been any of that going on here. Another problem is that economic data tends to be so very old; quarterly GDP data is hardly going to help with the here and now of trading.
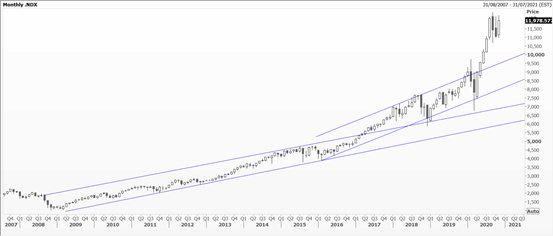
Source: Thomson Reuters Eikon. Monthly chart for the Nasdaq index. Past performance is not a guide to future performance
A fashionable strategy today is that of momentum, where one buys the leaders of the pack and loses the laggards. This postulates that there is such a thing as a trend and sticking with the winners is a good idea.
Both these concepts are based on technical analysis, which in turn takes this a step further by calculating oscillators based on internal momentum and the rate-of-change. Most trend-following strategies are based on these and moving averages.
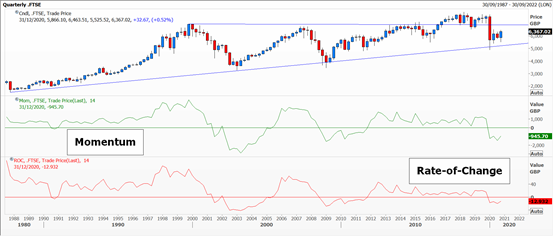
Source: Thomson Reuters Eikon. Quarterly chart for the FTSE 100 index. Past performance is not a guide to future performance
Over-exuberance (AKA greed) and exhaustion (fear) are concepts most laymen will understand. A book on the subject which I highly recommend is ‘Extraordinary Popular Delusions and the Madness of Crowds’ written by Charles Mackay in 1841. Candlesticks themselves and chart patterns can give very strong signals of when things have gotten out of hand.
Not only today, but over the last century (at least), social media have been monitored for signs of trends and turns. Today, algorithms will search and sort for media posts with positive versus negative comments on companies and industry sectors – reinforcing the momentum traders’ view.
Years ago, it was the Wall Street shoeshine boy giving his customer share tips, and with me the taxi driver asking for investment advice on my way to a media interview. Better still are screaming headlines in mainstream print media – because the writers tend to dislike and have minimum knowledge of finance.
- Charting for beginner investors: how to trade using trend lines
- Charting for beginner investors: recognising patterns
- Charting for beginner investors: the indicators chartists love
Proponents of automated trading often claim that it’s all based on artificial intelligence – to keep out the riff-raff. Some of it may be, but its origins are clearly based on technical oscillators which have been back-tested and fitted to suit specific markets and trading horizons.
The chart below shows a contract for Libor, or London Inter-Bank Offered Rate, which is the benchmark interest rate at which major global banks lend to one another.
This time period represents the epicentre of the collapse of Lehman Brothers and the Great Financial Crisis. I had spotted the chart patterns, understood the implications, and the bank I was working for avoided much of the carnage.
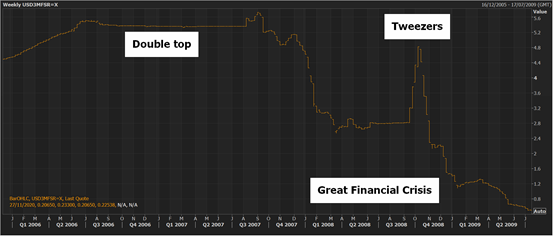
Source: Thomson Reuters Eikon. Quarterly chart for the interest rate of 3-month US dollar Libor. Past performance is not a guide to future performance
Looking back over the decades, who made serious money out of technical analysis (rather than studying economic trends or company reports)? Charles Dow is a name that springs to mind, one-time editor of the Wall Street Journal and creator of the eponymous US stock markets used continuously – and extensively – since.
One you may not have heard of is Jesse Livermore who was born into abject poverty in 1877 Massachusetts. Day trading using the ticker-tape as his guide, a form of reading price action only, he’s famous for shorting (selling) US stocks ahead of the 1906 San Francisco earthquake and then in 1929, where he made $1 million in a day taking his net worth to $100 million.
A more up to date success story is that of the ‘Turtle Traders’. After making $200 million as a trader, Richard Dennis and his business partner decided to conduct an experiment to see if successful trading could be taught. The 23 carefully selected candidates were given a fortnight’s tuition and $1 million to play with. In 1994, one of them was ranked at 25th of Wall Street’s most successful. A book on the scheme was published in 2007 and among them are legends like Paul Tudor Jones. Many, though not all, incorporated some elements of technical analysis in their style.
Walk into any professional dealing room and you will see that most traders and salesmen and women are looking at charts. Whether you do the same is up to you and your investment goals.
Nicole Elliott is a freelance contributor and not a direct employee of interactive investor.
A graduate of the London School of Economics and Political Science (BSc social psychology), Nicole Elliott has worked in banks in the City of London for the last 30 years. Whether in sales, trading or forecasting, technical analysis has always been the bedrock of her thinking. Her key expertise lies within all areas of Treasury: foreign exchange, money markets, fixed income and commodities. She has also added to the body of knowledge of the industry, writing the first Western book on Ichimoku Cloud Charts. Strong media links and a cult following are due to her prescient calls on the markets and often entertaining format.
These articles are provided for information purposes only. Occasionally, an opinion about whether to buy or sell a specific investment may be provided by third parties. The content is not intended to be a personal recommendation to buy or sell any financial instrument or product, or to adopt any investment strategy as it is not provided based on an assessment of your investing knowledge and experience, your financial situation or your investment objectives. The value of your investments, and the income derived from them, may go down as well as up. You may not get back all the money that you invest. The investments referred to in this article may not be suitable for all investors, and if in doubt, an investor should seek advice from a qualified investment adviser.
Full performance can be found on the company or index summary page on the interactive investor website. Simply click on the company's or index name highlighted in the article.