Commodities outlook: Unstoppable gold trumps oil
As global economic uncertainty makes gold attractive, demand for oil is on the wane.
18th July 2019 11:53
by Rajan Dhall from interactive investor
As global economic uncertainty makes gold attractive, demand for oil is on the wane.

Lots going on in the world of commodities over the last week as gold pushed higher and oil markets have suffered a tough couple of sessions.
After weeks of encouraging rhetoric from the US over the US-China trade deal, it seems Chinese phone company Huawei is now a major sticking point in getting a deal done.
Yesterday, the US commerce department said progress on the trade war has been halted until they can decide how to proceed with the Chinese tech giant. There has been little if any progress since the two nations met at the G20 meeting in Japan last month, and on Tuesday President Trump threatened to slap another $325 billion worth of tariffs again!
In relation to the recent fall in stocks, US 10-year yields also took a drop, implying a move into safer assets. The yield on offer is also pretty weak at 2.047%, so it seems that would help boost the gold rally as investors hunt for bigger returns.
Gold still flavour of the month
Other than a re-emergence of the risk story, it is said that central banks were increasing gold stockpiles in their droves last month. The People's Bank of China (PBoC) admitted it added another 10.3 tons in June following the 74 tons added to their vaults in the last six months.
Looking at the technical, the weekly chart is showing a new trend of higher highs and higher lows. The key resistance level market by the $1,377 dollars per ounce zone on the chart was broken and now could become an area of support.
Next point of concern for gold bulls is the $1,523 per ounce level which was used as support between 2011 and 2012. In the weekly chart below, the last couple of candles have shown a rejection of the highs, so keep an eye on tomorrow’s closing price for confirmation.
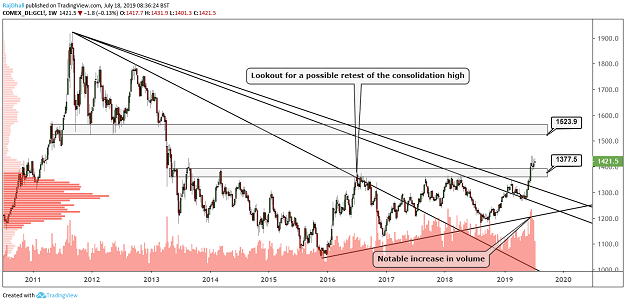
Source: TradingView Past performance is not a guide to future performance
When will oil slide end?
Oil markets have had a rough three days after American Petroleum Institute (API) inventories showed a rise in gasoline levels in the peak travel season in the US. This would suggest that demand has not been as strong as the producers anticipated.
It doesn't stop there, as tensions between the US and Iran seem to have softened somewhat after Iran said it could block the Strait of Hormuz but will not. Further to this, the Iranians also say they have nothing to do with a small oil tanker that had gone missing in the Persian Gulf, but it was said to be having technical difficulties and was towed into Iran for repairs.
Looking at the daily WTI futures chart, it is clear to see that bulls could not push the price through the psychological $60 per barrel level. Prices have fallen just over 7% since and are now hovering at $56 per barrel. The $55.50-80 region has been a strong zone of support in the past.
Next week, if there is a continuation in the gasoline inventory story, we could see a push down below support. Over the last week, volume has not been too high but at the last couple of tests at the $55 per barrel level we have seen a pick-up in activity. Watch carefully.
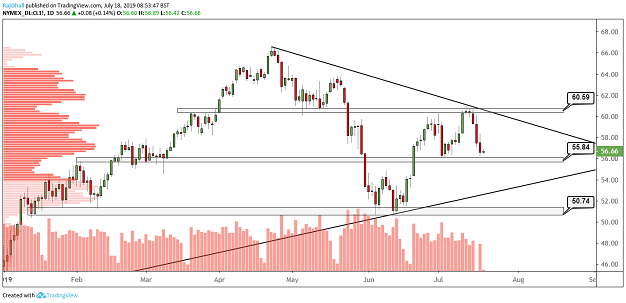
Source: TradingView Past performance is not a guide to future performance
Rajan Dhall is a freelance contributor and not a direct employee of interactive investor.
These articles are provided for information purposes only. Occasionally, an opinion about whether to buy or sell a specific investment may be provided by third parties. The content is not intended to be a personal recommendation to buy or sell any financial instrument or product, or to adopt any investment strategy as it is not provided based on an assessment of your investing knowledge and experience, your financial situation or your investment objectives. The value of your investments, and the income derived from them, may go down as well as up. You may not get back all the money that you invest. The investments referred to in this article may not be suitable for all investors, and if in doubt, an investor should seek advice from a qualified investment adviser.
Full performance can be found on the company or index summary page on the interactive investor website. Simply click on the company's or index name highlighted in the article.