eyeQ: what to do with dividend stock Aviva?
interactive investor has teamed up with the experts at eyeQ who use artificial intelligence and their own smart machine to generate actionable trading signals. Here’s what it tells us about this FTSE 100 income play.
29th February 2024 09:45
by Huw Roberts from eyeQ

"Our signals are crafted through macro-valuation, trend analysis, and meticulous back-testing. This combination ensures a comprehensive evaluation of an asset's value, market conditions, and historical performance." eyeQ
- Discover: eyeQ analysis explained | eyeQ: our smart machine in action | Glossary
Aviva
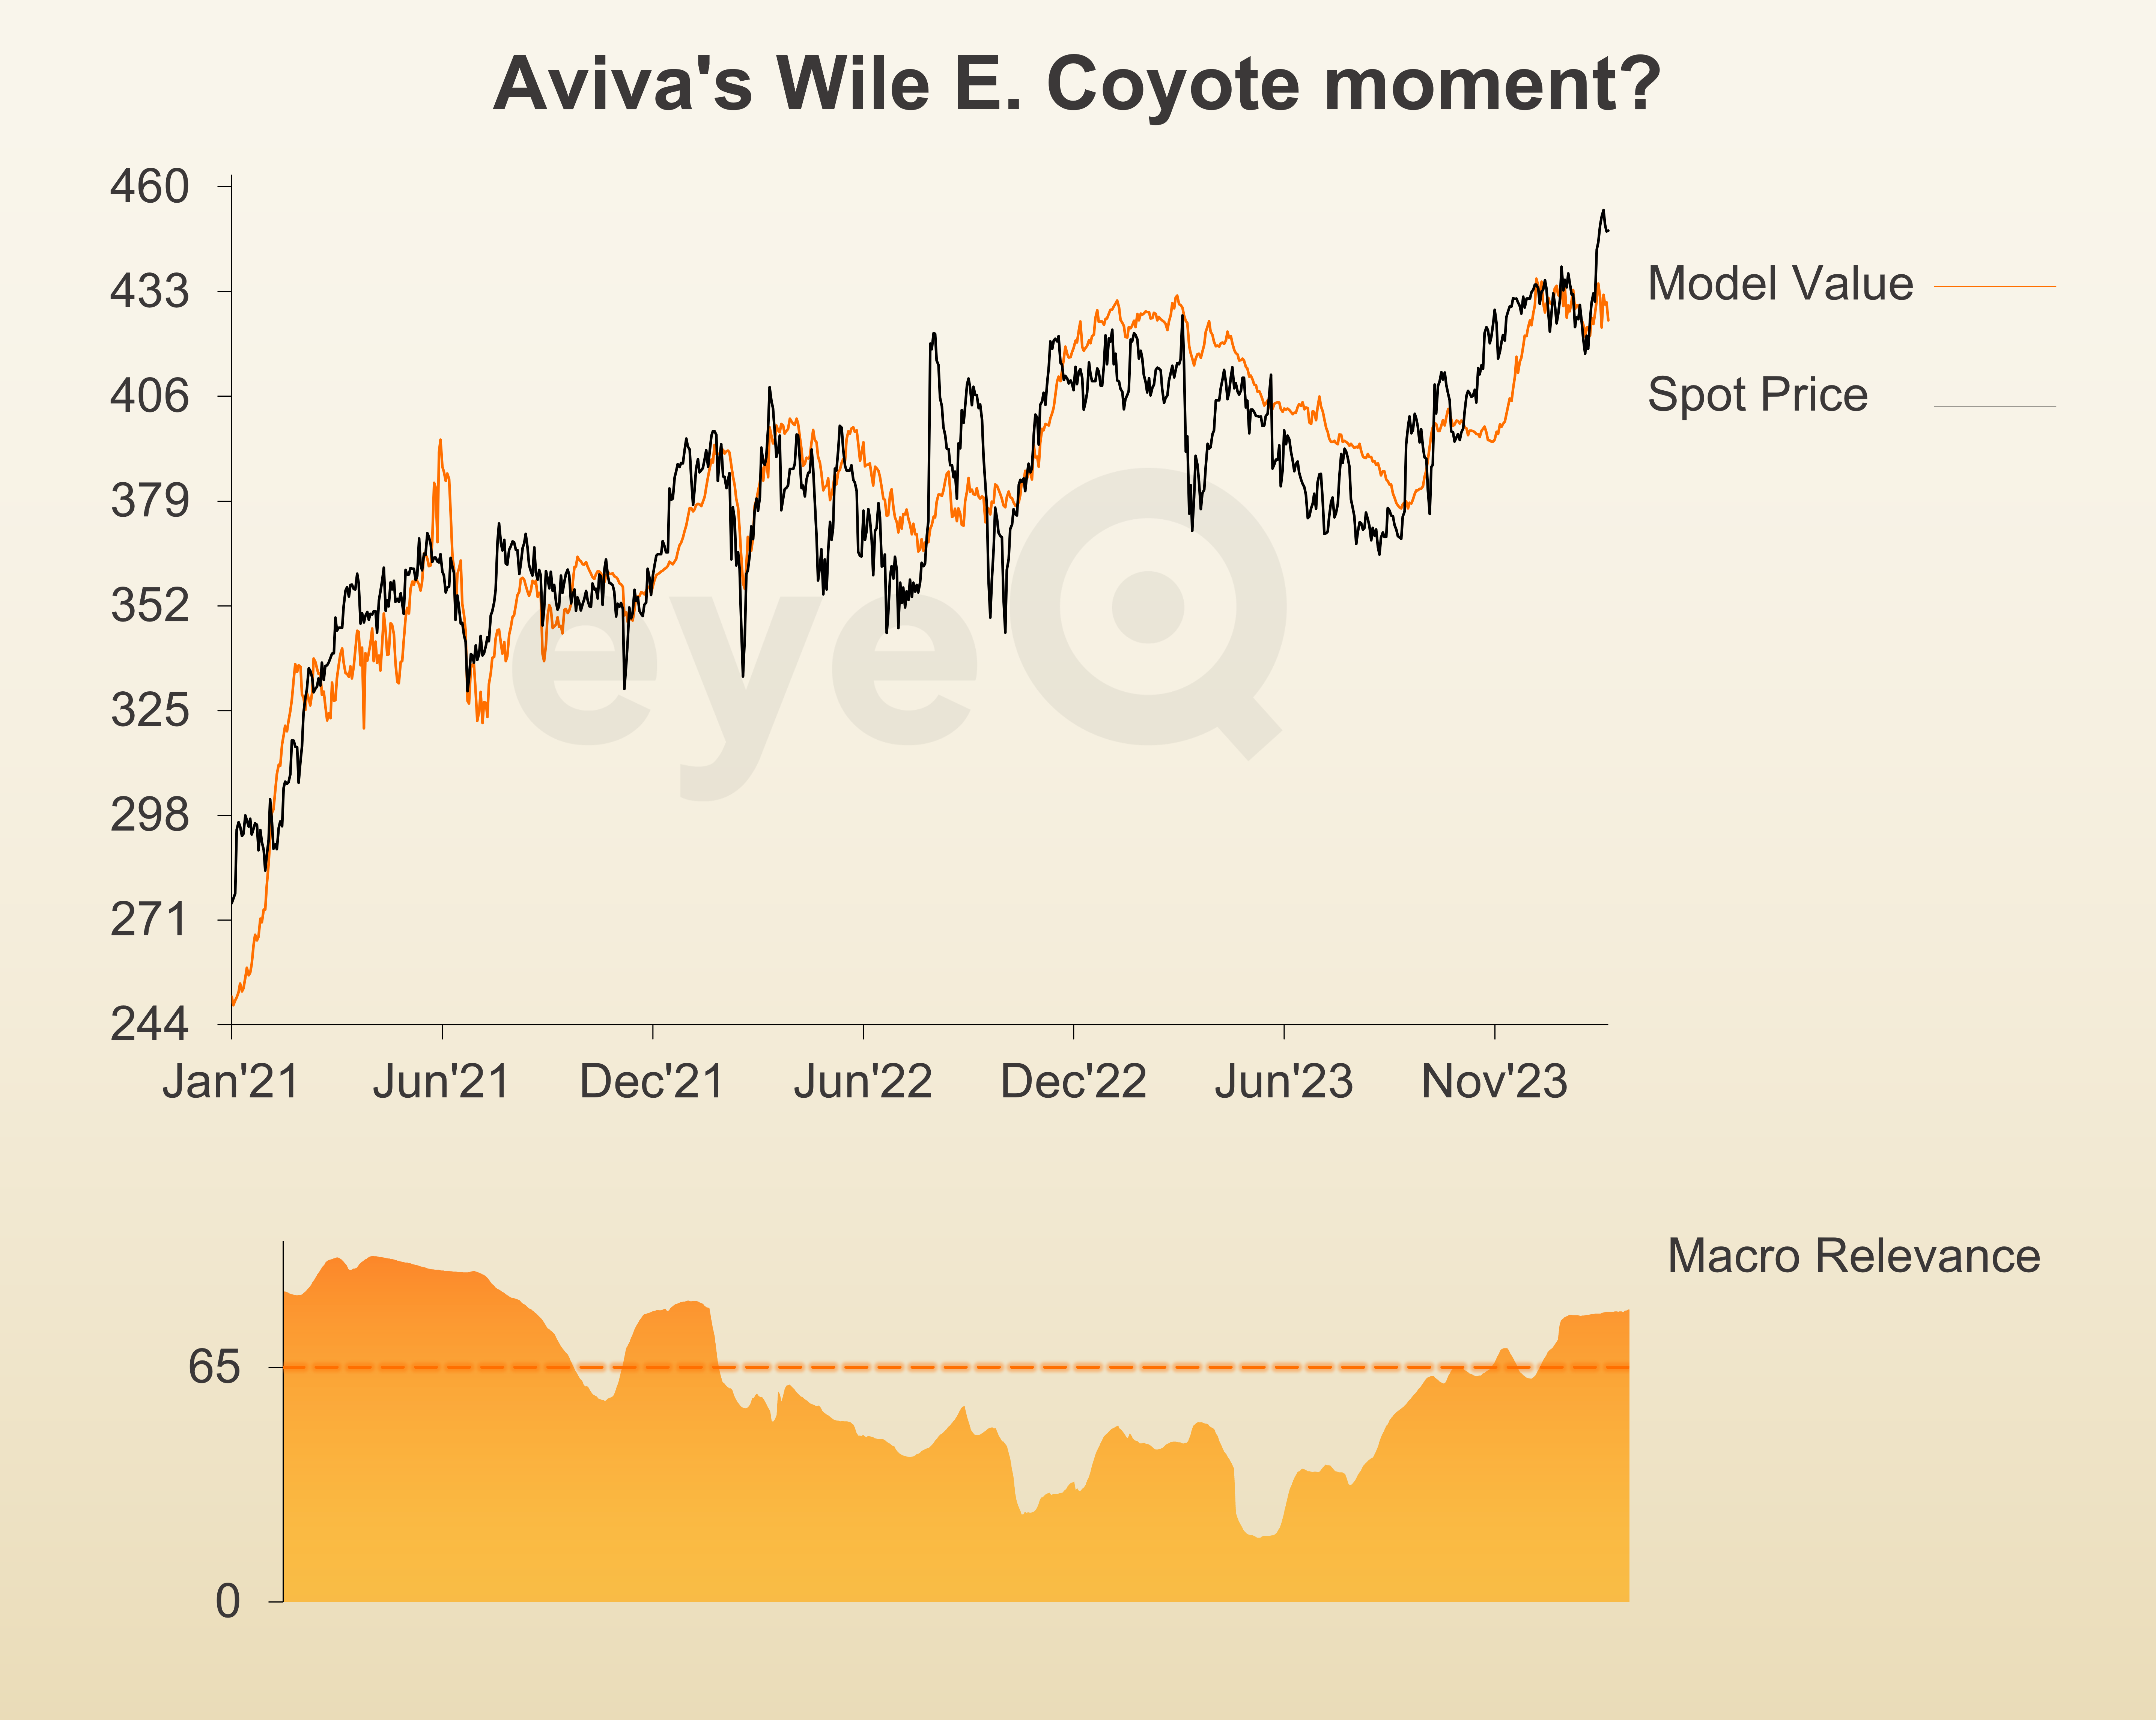
Trading signal: strategic long-term model
Model value:425.28p
Fair Value Gap (premium/discount to Model Value): +4.92%
Model relevance: 81%
Data correct on 29 February 2024. Please click glossary for explanation of terms.
Aviva shares are up around 8% from the mid-February lows. A number of analysts have started to upgrade the UK insurance sector, attracted by the high dividend yields on offer.
Fair enough. Company fundamentals are important.
But after a prolonged period when bottom-up analysis was the only thing that mattered for Aviva (LSE:AV.)’s share price, note that macro conditions have reasserted themselves.
eyeQ’s AI-driven smart machine shows macro relevance (how confident we are in our model value) of 81%. Investors need to be aware that big-picture dynamics such as economic growth, inflation, credit spreads and more are having a big impact on the share price.
Moreover, there’s a disconnect appearing. Overall macro conditions have moved sideways as different macro drivers pull in opposite directions, offsetting one another. For lovers of detail, Aviva wants stronger GDP growth, and the economic data has bounced in February. But it also wants low inflation and the Bank of England to keep monetary policy easy – this has worked against the stock price of late.
The bottom line is that macro conditions are flatlining and have not justified the latest rally at Aviva; and that leaves the stock 4.9% rich to eyeQ’s model fair value.
Buy-and-hold investors might be happy to look through such news and enjoy their dividend income. Again, fair enough.
But, for those looking to finesse the timing of their investments, the message is twofold:
- If you’ve yet to invest, wait. Relative to the big-picture environment, Aviva shares look extended and could correct lower, thereby providing better entry levels.
- To those already invested but worried that equity markets are starting to look a bit frothy, Aviva could be a candidate for a little profit-taking.
Source: eyeQ. Past performance is not a guide to future performance.
Useful terminology:
Model value
Where our smart machine calculates that any stock market index, singe stock or exchange-traded fund (ETF) should be priced (the fair value) given the overall macroeconomic environment.
Model (macro) relevance
How confident we are in the model value. The higher the number the better! Above 65% means the macro environment is critical, so any valuation signals carry strong weight. Below 65%, we deem that something other than macro is driving the price.
Fair Value Gap (FVG)
The difference between our model value (fair value) and where the price currently is. A positive Fair Value Gap means the security is above the model value, which we refer to as “rich”. A negative FVG means that it's cheap. The bigger the FVG, the bigger the dislocation and therefore a better entry level for trades.
Long Term model
This model looks at share prices over the last 12 months, captures the company’s relationship with growth, inflation, currency shifts, central bank policy etc and calculates our key results - model value, model relevance, Fair Value Gap.
These third-party research articles are provided by eyeQ (Quant Insight). interactive investor does not make any representation as to the completeness, accuracy or timeliness of the information provided, nor do we accept any liability for any losses, costs, liabilities or expenses that may arise directly or indirectly from your use of, or reliance on, the information (except where we have acted negligently, fraudulently or in wilful default in relation to the production or distribution of the information).
The value of your investments may go down as well as up. You may not get back all the money that you invest.
Equity research is provided for information purposes only. Neither eyeQ (Quant Insight) nor interactive investor have considered your personal circumstances, and the information provided should not be considered a personal recommendation. If you are in any doubt as to the action you should take, please consult an authorised financial adviser.
Disclosure
We use a combination of fundamental and technical analysis in forming our view as to the valuation and prospects of an investment. Where relevant we have set out those particular matters we think are important in the above article, but further detail can be found here.
Please note that our article on this investment should not be considered to be a regular publication.
Details of all recommendations issued by ii during the previous 12-month period can be found here.
ii adheres to a strict code of conduct. Contributors may hold shares or have other interests in companies included in these portfolios, which could create a conflict of interests. Contributors intending to write about any financial instruments in which they have an interest are required to disclose such interest to ii and in the article itself. ii will at all times consider whether such interest impairs the objectivity of the recommendation.
In addition, individuals involved in the production of investment articles are subject to a personal account dealing restriction, which prevents them from placing a transaction in the specified instrument(s) for a period before and for five working days after such publication. This is to avoid personal interests conflicting with the interests of the recipients of those investment articles.