Fevertree's remarkable turnaround
A 15% trading range following annual results shows how divided opinion is on this AIM favourite now.
26th March 2019 13:06
by Graeme Evans from interactive investor
A 15% trading range following annual results shows how divided opinion is on this AIM favourite now.

Having accelerated from £158 million at IPO to a £3 billion-rated company in just over four years, posh mixers firm Fevertree Drinks (LSE:FEVR) underlined again today why it is regarded in the City as one of the "most attractive growth stories in European beverages".
Its annual results showing a 36% jump in earnings per share to 53.19p for 2018 helped shares rally over 6% at one point today. However, the performance continues to mask worries that the remarkable Fevertree story is in danger of running out of steam, particularly given that the AIM-listed company is still trading on a whopping price/earnings (PE) multiple of 56x. It was one of the reasons behind a slump of over 8% at Tuesday's opening bell.
The stock has certainly wobbled since hitting a peak of around 4,000p in the summer, partly in the wake of last autumn's stock market slump as well as doubts about whether its smaller overseas operations are capable of sustaining the growth trajectory.
The UK continues to go well, with revenues in 2018 rising 53% to £134.2 million after Fevertree consolidated its position as the leading mixer brand in UK retail with a 42% market share. But with CEO Tim Warrillow acknowledging that slower growth rates are likely in the UK this year, the focus of investors is on whether the United States and Europe can take up the slack.
The potential for further growth in North America is huge, with Fevertree's recent move to wholly-owned operations meaning it now directly manages marketing, sales and distribution.
This has already resulted in an agreement with Southern Glazer's Wine and Spirits to be the group's exclusive on-trade partner across numerous states.
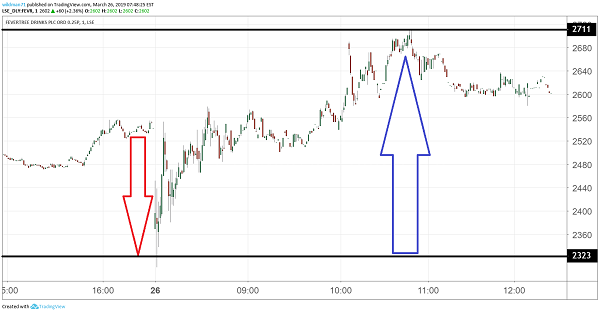
Source: TradingView (*) Past performance is not a guide to future performance
But as today's results show, it is still far too early to assess how the company will fare in the United States, even though sales did grow 21% in 2018 despite significant operational changes. The second half of the year also showed an accelerating trend, while the focus in 2019 is likely to be on building the distribution footprint and key trading relationships.
Fevertree believes it has a strong platform for growth in North America due to the premium mixer market being at a relatively early stage. However, it is likely to face fierce competition in a soft drinks market dominated by Pepsi and Coca-Cola.
With so much depending on the United States expansion, analysts at Jefferies are adopting a wait-and-see approach until further evidence of US sales acceleration.
They said today:
"Fevertree remains one of the most attractive growth stories in European beverages given the potential for premium mixers internationally. However, near term we see a risk of a hiatus period as growth in the UK core business moderates before the US accelerates."
The broker expects revenues to grow 18% this year, with the UK moderating to 12.5% and the US improving to 25%. Margins are likely to remain under pressure, having fallen to 51.8% in 2018 from 53.5% a year earlier due to the impact of the UK sugar tax last April.
Jefferies, which has a price target of 3,250p, said today's EPS figure was 3% higher than it expected. The total dividend was lifted to 14.50p a share from 10.65p a year ago.
Fevertree joined the stock market in November 2014 at a price of 134p. Since then, it has gained a reputation for its regular upgrades to profit forecasts, with any trading updates and results without a boost to expectations usually the trigger for profit-taking.
In the UK, it has benefited from the popularity of the long-mixed drink, be it a gin & tonic, vodka & ginger beer or whiskey & ginger ale. Whether this level of appetite continues in the face of more economic turbulence remains to be seen.
*Horizontal lines on charts represent levels of previous technical support and resistance.
These articles are provided for information purposes only. Occasionally, an opinion about whether to buy or sell a specific investment may be provided by third parties. The content is not intended to be a personal recommendation to buy or sell any financial instrument or product, or to adopt any investment strategy as it is not provided based on an assessment of your investing knowledge and experience, your financial situation or your investment objectives. The value of your investments, and the income derived from them, may go down as well as up. You may not get back all the money that you invest. The investments referred to in this article may not be suitable for all investors, and if in doubt, an investor should seek advice from a qualified investment adviser.
Full performance can be found on the company or index summary page on the interactive investor website. Simply click on the company's or index name highlighted in the article.