FTSE for Friday, Wall Street, and the S&P too
11th June 2021 07:44
by Alistair Strang from Trends and Targets
Analyst Alistair Strang gives his assessment of prospects for both the UK's leading index and stock markets in the US.
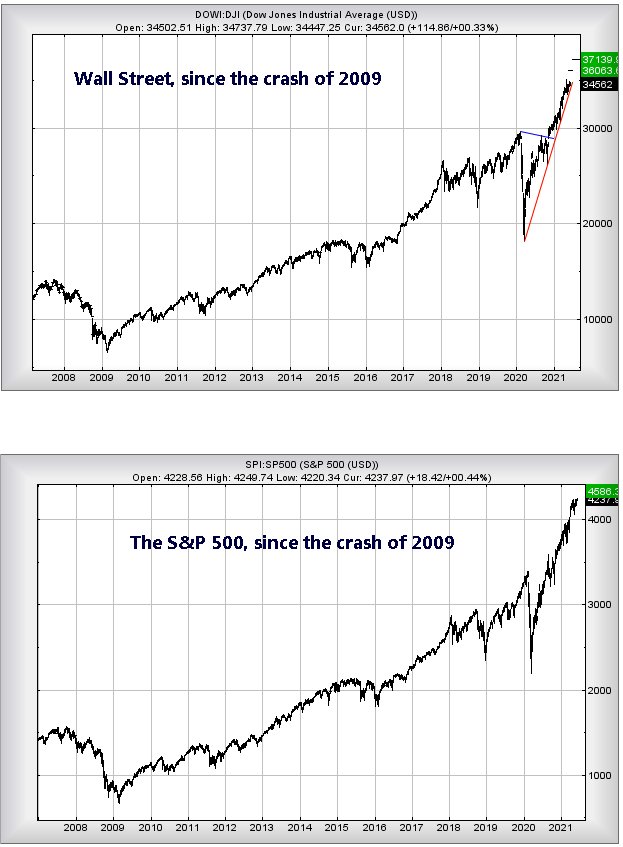
There’s something quite curious happening with the major US indices. The S&P 500 recently achieved logical high levels, one of these points in time where we tend to suspect some volatility will be required, prior to a future lift. Wall Street, on the other hand, has not yet achieved the level at which we’d expect the markets to throw a bit of a wobble, and it’s creating a pretty vague situation.
Our problem is simple. We calculated 4,265 as a level where some hesitation was expected on the S&P, the index essentially fluttering a few points below this level for the last month. Currently, the market exhibits no signs of impending disaster, just a rigid refusal to actually climb higher. On the other hand, the Dow Jones still has a fair bit of climbing to match the current strength of the S&P, needing to reach a stonking 36,063 points.
The question is fairly simple. Will Wall St discover sufficient oomph for a further 1,000-point gain while the S&P continues to waffle around? Or will the S&P achieve some slight gains, should Wall Street start to power upward. We’ve decided to set above 4,265 as a major trigger event for the S&P. Above this level looks capable of a lift to 4,333 points initially with secondary, if exceeded, calculating at 4,586 along with some very possible hesitation.
- Month in the markets: reflation trade stays on course
- Want to buy and sell international shares? It’s easy to do. Here’s how
- Why reading charts can help you become a better investor
Wall St, conversely, needs above a trigger of 35,290 to suggest impending growth coming to an initial 36,063 points. If bettered (and cannot believe we’re writing this), our secondary works out at an impossible sounding 37,139 points. Similar to the S&P, we anticipate some market volatility should such a level appear.
The charts below highlight the brutal strength of the two US indices since the crash of 2009. Had the two markets moved in sympathy with the UK market, the highest they would have achieved by now would be 17,000 points for Wall St and 2,100 points for the S&P. Instead, for every step upward in the UK, the two primary US markets have taken two steps, a quite dreadful situation given the FTSE and the Dow Jones were regarded as joined at the hip until the financial crash of 2009.
Source: Trends and Targets. Past performance is not a guide to future performance
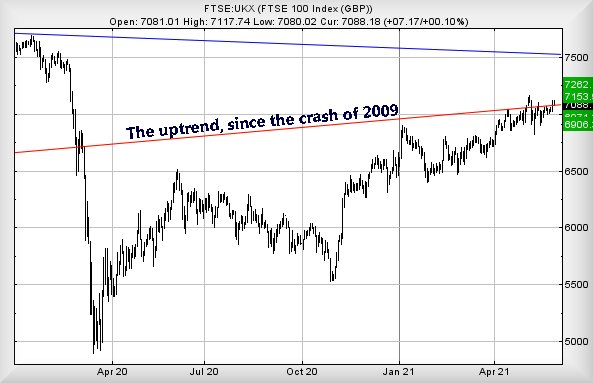
As for our FTSE for Friday, despite the UK market (and others) appearing to take a “watch and wait” stance since the start of May, we keep feeling slight touches of optimism, a bit like seeing green shoots between paving slabs, a few days prior to a bunch of weeds suddenly surging upward. It begs the question, who’s got the weed killer for the FTSE to crush hope?
Will it be Covid-19, Boris, space aliens, or the ongoing Brexit shambles?
At time of writing, the FTSE is trading around 7,090 points and only requires exceed 7,122, as this will apparently trigger a surge in the direction of 7,153 points. If bettered, we’d hope to see our secondary calculation of 7,262 pretty fast thereafter. Or at least, in normal times we would.
- Two valuable lessons for every investor
- Read more of our content on UK shares here
- Check out our award-winning stocks and shares ISA
As the chart below displays with boring clarity, the FTSE continues to pole dance along the Red uptrend, a line which dates back to the lows of 2009 and the market crash. Those folk of a nervous disposition will doubtless only be convinced any upward break is real, if the FTSE finds an excuse to better its prior high of 7,164 points, achieved last month on 10 May.
Our converse scenario for the FTSE suggests the index needs to trade below 7,040 points to justify some near-term concern. This is liable to trigger reversals to an initial 6,971 points. If broken, our secondary calculates at 6,906 and the visuals hint at a bounce, should such a level make an appearance.
Source: Trends and Targets. Past performance is not a guide to future performance
Alistair Strang has led high-profile and "top secret" software projects since the late 1970s and won the original John Logie Baird Award for inventors and innovators. After the financial crash, he wanted to know "how it worked" with a view to mimicking existing trading formulas and predicting what was coming next. His results speak for themselves as he continually refines the methodology.
Alistair Strang is a freelance contributor and not a direct employee of Interactive Investor. All correspondence is with Alistair Strang, who for these purposes is deemed a third-party supplier. Buying, selling and investing in shares is not without risk. Market and company movement will affect your performance and you may get back less than you invest. Neither Alistair Strang or Interactive Investor will be responsible for any losses that may be incurred as a result of following a trading idea.
These articles are provided for information purposes only. Occasionally, an opinion about whether to buy or sell a specific investment may be provided by third parties. The content is not intended to be a personal recommendation to buy or sell any financial instrument or product, or to adopt any investment strategy as it is not provided based on an assessment of your investing knowledge and experience, your financial situation or your investment objectives. The value of your investments, and the income derived from them, may go down as well as up. You may not get back all the money that you invest. The investments referred to in this article may not be suitable for all investors, and if in doubt, an investor should seek advice from a qualified investment adviser.
Full performance can be found on the company or index summary page on the interactive investor website. Simply click on the company's or index name highlighted in the article.