How to buy investment trusts that outperform
Research shows that attempting to time the market is, more often than not, a mug's game.
16th August 2019 15:35
This content is provided by Kepler Trust Intelligence, an investment trust focused website for private and professional investors. Kepler Trust Intelligence is a third-party supplier and not part of interactive investor. It is provided for information only and does not constitute a personal recommendation.
Material produced by Kepler Trust Intelligence should be considered a marketing communication, and is not independent research.
Research shows that attempting to time the market is, more often than not, a mug's game. Here's how to increase your chances of success.

Dangerous ground: the perils of timing the market
Thomas McMahon, senior analyst at Kepler Trust Intelligence.
Anyone who takes a strong interest in financial markets sometimes feels the pull of market timing. It is seductive to imagine yourself a canny trader, buying or selling positions just before the market shifts, trading investments daily and beating the herd with superior analysis and instincts. We can add to the existing research suggesting this is a bad idea, and that taking a long-term view of your investments is the way to go.
We looked at investment trusts that have outperformed over the past ten years and ran monthly NAV returns. We then calculated how many months were responsible for their outperformance. In other words, how many months did you need to miss to have ended up with market performance or less, negating any benefit of choosing an active fund over a passive fund? The results were surprisingly low, suggesting that switching in and out of investment trusts is fraught with danger and a potential recipe for underperformance. Instead, investing for the long term and staying invested gives a greater chance of outperforming, we suggest.
The test
Our research was inspired by a recent paper from Morningstar's Manager Research team in North America, looking at open-ended funds globally over a period of ten years. We have applied a similar test outlined in their paper to the UK-listed investment trust universe, examining all those UK trusts in the major equity sectors with a track record going back to 2001. This is the earliest that the NAV data in the Morningstar database is complete enough.
We decided to look at core equity trusts (i.e. large-cap and all-cap). We calculated monthly excess returns against the trusts' benchmarks up to June 2019, having selected the benchmarks quantitatively, before sense-checking and adjusting when necessary.
Having run the data, we focused on those trusts that had outperformed over the period. We then eliminated the best months one by one until the excess returns were exhausted. We did this by setting the excess return for that month to zero, assuming that the trust performed exactly in line with the benchmark in that month.
We counted how many months we had to write down to zero before the trust's excess returns over the whole period were zero or below, which we follow Morningstar in calling the "critical months".
There were a few outliers in each sector, but overall it was striking how few months the trusts had depended on to provide their outperformance, even when that outperformance was considerable.
Conclusions
We present below a table of the results that shows a remarkable consistency across the sectors. The overall average number of critical months was just 7.4, and the median 7. This means that half of the trusts that outperformed did so only because of fewer than seven individual months out of 222, or 3% of the sample.
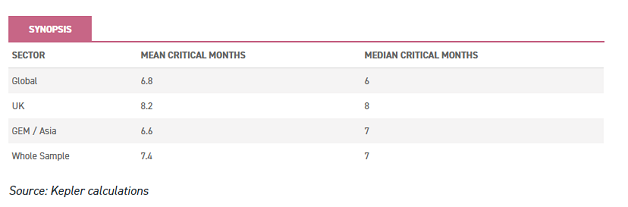
This means that, if an investor had correctly identified the outperforming managers but traded in and out in an attempt to add value through market timing, they only needed to miss six particular months on average to have gained the same as the market or worse. In half the cases, it would have taken fewer than six missed months of outperformance to wipe out any alpha. This strongly suggests that staying invested is a prudent investment strategy if the aim is to outperform the benchmark.
We do find that there is a connection between the extent of outperformance and the number of critical months, perhaps unsurprisingly. Looking across the whole sample of 37 trusts, the top quartile of outperformers had an average critical month value of 12.1, the second quartile 9.6, the third 6.2 and the fourth 2.3.
We found it interesting that the most commonly shared critical months in all three sectors came in the two most significant down markets during the period. These were not the months with the greatest outperformance, but the most commonly shared. Nonetheless, it is interesting that many of the outperforming trusts tend to have the ability to moderate losses in the worst markets in common.
Our numbers are close to those generated by Morningstar in their note on open-ended funds. This is even though they looked back over only ten years and examined many more funds (3,753 outperformers). They found a mean critical months value of 7.4 and median of 6 in their sample.
We have frequently highlighted the structural benefits of investment trusts in generating long-term outperformance. Last summer, for example, we highlighted research showing that investment trusts had outperformed their open-ended peers since 2000, and on average outperformed their benchmarks net of fees too.
In our view, that research highlighted the most significant factor is the closed-ended structure, which allows the manager to manage the portfolio rather than inflows and outflows, and to invest more in illiquid investments with greater return potential. However, the results from our new research suggest that, despite these advantages, closed-ended funds are as dependent as open-ended funds on a relatively low number of months to generate their outperformance. In other words, while you have a greater chance of outperforming in a closed-ended fund, you likely need to remain invested over the longer run and resist the urge to trade in and out to benefit from this structural advantage. This is quite possibly easier said than done, particularly when markets are in meltdown.
Below we look at the results in the individual sectors, and highlight some of the long-term outperformers that stand out from our study. We have concentrated on those with the same manager and mandate over the period, and selected two from each sector.
UK trusts
We looked across the UK Equity Income and UK All Companies sectors. We found 17 trusts with a track record long enough to qualify and had outperformed over our period. The average critical months was 8.2, or 6.9% of the months over the period. This is despite the even more striking outlier Finsbury Growth & Income (LSE:FGT), which had a critical month figure of 25, the highest across all the sectors we examined. We have focused on large and mid-cap dominated strategies for this analysis, as we believe that small-cap markets are structurally more conducive to alpha generation. This means we are wary of including Chelverton UK Dividend Trust (LSE:SDV), Fidelity Special Values and Independent in the same analysis. Excluding those three trusts, the critical months average falls slightly to 7.9.
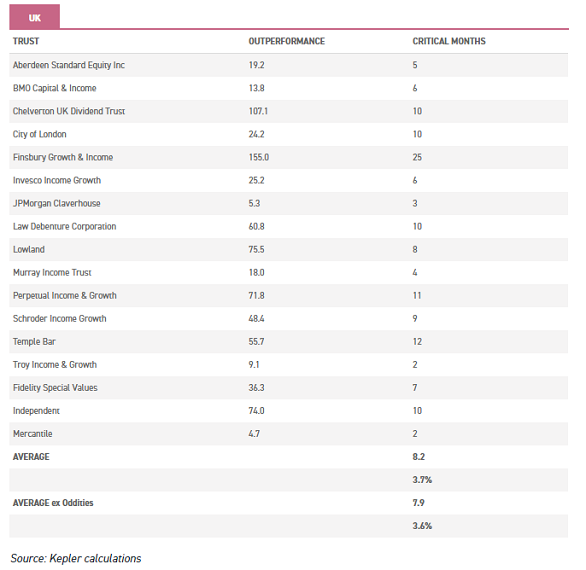
In the UK sectors, two months stand out as being particularly critical to returns. These were the months which were critical months for the most individual trusts in the sector. The first is February 2001, the second in our sample. This was a down month in the aftermath of the tech bubble. The second is September 2008, one of the worst months in the stock market crash that followed the financial crisis.
Finsbury Growth & Income
Finsbury Growth & Income has been managed by Nick Train since 2001, when Lindsell Train won the management contract. Its performance in absolute and relative terms has been exceptional: the excess return of 155% over our period is higher than all other trusts to qualify in any of the sectors we examined. The critical months value of 25 is also the highest in our sector, with the second-highest total being 17. This means you would have had marginally better chance of outperforming if you had traded in and out of FGT over the years. But even this outlying figure is only 11.3% of months in the sample. If you had missed the wrong 11.3% of the months over this period, even in FGT you would only have received index returns.
City of London
Job Curtis has run City of London (LSE:CTY) since 1991 with the twin objectives of income and capital growth. Under his tenure, the trust has raised its dividend each year and yields 4.7%. He takes a steady approach, expecting to outperform gradually over the medium to long term, fully accepting that over short periods he may underperform. That steadiness is reflected in the results above; the critical months value of 10 is one of the highest in our UK sector, while the outperformance over the period is one of the lowest. In other words, outperformance tends to be little and often relative to peers.
This steadiness and the spotless income record have meant that the trust tends to trade on a premium, which is currently 1.4%.
Global Trusts
In the global and global equity income sectors, the picture is similar. We found that the average critical months figure for the nine trusts that met our requirements was just 6.8, or 3.1% of the 222 months in our data. This is despite the massive outlier of Scottish Mortgage, which had a critical months figure of 17 (no other trust was in double figures).
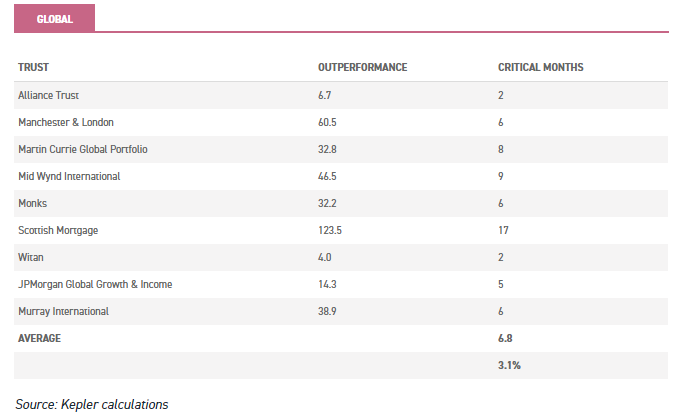
The most common critical month was April 2002, being a month that provided some of the highest excess returns for four of the trusts in the sample. April 2002 was a fairly undistinguished down month during the declining market that followed the tech bubble. In fact, greater losses to global equity markets came in June and July that year.
Scottish Mortgage
Scottish Mortgage (LSE:SMT) has the second-highest critical months value out of all trusts tested, behind only Finsbury Growth & Income. James Anderson took over management in 2000 and was joined by Tom Slater in 2009. The trust is highly concentrated, highly active and low cost, with the latter helped by it reaching a large enough market cap to qualify for the FTSE 100. The trust is highly focused on technology and related areas, with an aim of picking those companies that will be the long-term winners in the market. The managers aim to hold companies for at least five years and the top 10 holdings account for 50% of the fund. Increasingly, the portfolio has shifted into unquoted investments too, with 19.4% in unlisted companies as of 30 June.
Long-term returns have been outstanding, with the trust generating NAV total returns of 167.1% over the past five years compared to 89.3% from the MSCI AC World, and 515.6% over ten years compared to 231.2% for the index. The trust is trading on a premium of 2.7% and is a frequent issuer of shares to keep the premium down.
Martin Currie Global Portfolio Trust
Martin Currie Global Portfolio (LSE:MNP) was managed by Tom Walker for 18 years until 2018. His performance delivered the second-highest critical months value in the Global and Global Equity income sector. Over his tenure, the trust returned 9.5% a year compared to 8.9% for the FTSE World Index. However, relative performance had been weak in Tom's final few years, with the trust underexposed to technology. Zehrid Osmani was therefore appointed manager and has revamped the portfolio. It now has an active share of 94% and is highly concentrated, with only 34 holdings.
The change of manager has been extremely successful so far, with the trust outperforming its benchmark and peers significantly. Year-to-date, the trust has generated NAV total returns of close to 25% versus 18% for the FTSE World and 20% for the AIC Global Equity peer group. Under his tenure, Zehrid has returned 18% versus 11% for the index and 9% for the peer group. Only Lindsell Train has generated higher alpha over the period, however MNP has displayed lower volatility. The trust is now trading on a premium of 2.7%, having previously traded on a discount. We will be publishing an update to our note next week.
GEM / Asia Trusts
Turning to the emerging markets and Asia trusts, which we considered together, we find a similar "critical month" figure as for the developed world equity markets. We thought it possible that, given emerging markets tend to be less efficient than major developed markets, we would find that active trusts outperformed more frequently and therefore wouldn’t be so dependent on a few months for their outperformance. However, our research produced an average critical month figure of 6.6 for the 11 qualifying trusts, almost exactly in line with the global sector and just 5.5% of the months in our sample.
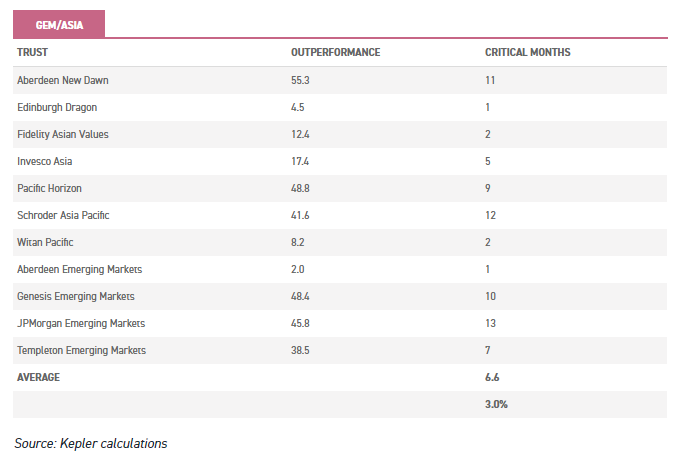
When we looked at the critical months held in common, we found there was less clustering in these sectors. Two individual months were critical to the returns of three trusts, and no month was more important to more than three trusts. These two months were March 2001 and November 2007, and therefore fit the same pattern as the other sectors by coming from the major bears markets over the period.
JPMorgan Emerging Markets
JPMorgan Emerging Markets (LSE:JMG) has been run by Austin Forey since 1994. Over our period it has generated excess NAV total returns of 45.8%, according to Morningstar data, with the highest critical months figure in the combined GEM and Asia sector. This implies that its outperformance has been more consistent and less dependent on a few months than any of the other trusts to outperform in our sector.
Austin takes a long-term approach to stock picking. He focuses on identifying companies with the potential to continue compounding their earnings faster than the market over the course of many years, holding onto them through their cyclical ups and downs in valuation and share price performance. The trust has been a consistent outperformer in rising and falling markets, beating its benchmark index in NAV total return terms in seven of the past ten years. The trust is trading on a discount of 7.6%, compared to a 9% sector average.
Schroder Asia Pacific
Schroder AsiaPacific (LSE:SDP) has been managed by Matthew Dobbs since launch in 1995. It is the most consistent of the Asia trusts in our sector, with 12 critical months.
Matthew draws on the expertise of a team of 39 analysts spread across seven countries in the region as the principal source for his ideas. Fundamental analysis focuses on growth and quality metrics, as well as corporate governance. Finally, Matthew is attentive to entry prices and sets target prices for the positions he takes up to guide his sales. The trust has significantly outperformed over three and five-year periods, yet trades on a discount of 10.8% compared to a sector average of 6.9%.
Kepler Partners is a third-party supplier and not part of interactive investor. Neither Kepler Partners or interactive investor will be responsible for any losses that may be incurred as a result of a trading idea.
Full performance can be found on the company or index summary page on the interactive investor website. Simply click on the company's or index name highlighted in the article.
Important Information
Kepler Partners is not authorised to make recommendations to Retail Clients. This report is based on factual information only, and is solely for information purposes only and any views contained in it must not be construed as investment or tax advice or a recommendation to buy, sell or take any action in relation to any investment.
This report has been issued by Kepler Partners LLP solely for information purposes only and the views contained in it must not be construed as investment or tax advice or a recommendation to buy, sell or take any action in relation to any investment. If you are unclear about any of the information on this website or its suitability for you, please contact your financial or tax adviser, or an independent financial or tax adviser before making any investment or financial decisions.
The information provided on this website is not intended for distribution to, or use by, any person or entity in any jurisdiction or country where such distribution or use would be contrary to law or regulation or which would subject Kepler Partners LLP to any registration requirement within such jurisdiction or country. Persons who access this information are required to inform themselves and to comply with any such restrictions. In particular, this website is exclusively for non-US Persons. The information in this website is not for distribution to and does not constitute an offer to sell or the solicitation of any offer to buy any securities in the United States of America to or for the benefit of US Persons.
This is a marketing document, should be considered non-independent research and is subject to the rules in COBS 12.3 relating to such research. It has not been prepared in accordance with legal requirements designed to promote the independence of investment research.
No representation or warranty, express or implied, is given by any person as to the accuracy or completeness of the information and no responsibility or liability is accepted for the accuracy or sufficiency of any of the information, for any errors, omissions or misstatements, negligent or otherwise. Any views and opinions, whilst given in good faith, are subject to change without notice.
This is not an official confirmation of terms and is not to be taken as advice to take any action in relation to any investment mentioned herein. Any prices or quotations contained herein are indicative only.
Kepler Partners LLP (including its partners, employees and representatives) or a connected person may have positions in or options on the securities detailed in this report, and may buy, sell or offer to purchase or sell such securities from time to time, but will at all times be subject to restrictions imposed by the firm's internal rules. A copy of the firm's conflict of interest policy is available on request.
Past performance is not necessarily a guide to the future. The value of investments can fall as well as rise and you may get back less than you invested when you decide to sell your investments. It is strongly recommended that Independent financial advice should be taken before entering into any financial transaction.
PLEASE SEE ALSO OUR TERMS AND CONDITIONS
Kepler Partners LLP is a limited liability partnership registered in England and Wales at 9/10 Savile Row, London W1S 3PF with registered number OC334771.
Kepler Partners LLP is authorised and regulated by the Financial Conduct Authority.
Kepler Partners is a third-party supplier and not part of interactive investor. Neither Kepler Partners or interactive investor will be responsible for any losses that may be incurred as a result of a trading idea.
These articles are provided for information purposes only. Occasionally, an opinion about whether to buy or sell a specific investment may be provided by third parties. The content is not intended to be a personal recommendation to buy or sell any financial instrument or product, or to adopt any investment strategy as it is not provided based on an assessment of your investing knowledge and experience, your financial situation or your investment objectives. The value of your investments, and the income derived from them, may go down as well as up. You may not get back all the money that you invest. The investments referred to in this article may not be suitable for all investors, and if in doubt, an investor should seek advice from a qualified investment adviser.
Full performance can be found on the company or index summary page on the interactive investor website. Simply click on the company's or index name highlighted in the article.
Important Information
Kepler Partners is not authorised to make recommendations to Retail Clients. This report is based on factual information only, and is solely for information purposes only and any views contained in it must not be construed as investment or tax advice or a recommendation to buy, sell or take any action in relation to any investment.
This report has been issued by Kepler Partners LLP solely for information purposes only and the views contained in it must not be construed as investment or tax advice or a recommendation to buy, sell or take any action in relation to any investment. If you are unclear about any of the information on this website or its suitability for you, please contact your financial or tax adviser, or an independent financial or tax adviser before making any investment or financial decisions.
The information provided on this website is not intended for distribution to, or use by, any person or entity in any jurisdiction or country where such distribution or use would be contrary to law or regulation or which would subject Kepler Partners LLP to any registration requirement within such jurisdiction or country. Persons who access this information are required to inform themselves and to comply with any such restrictions. In particular, this website is exclusively for non-US Persons. The information in this website is not for distribution to and does not constitute an offer to sell or the solicitation of any offer to buy any securities in the United States of America to or for the benefit of US Persons.
This is a marketing document, should be considered non-independent research and is subject to the rules in COBS 12.3 relating to such research. It has not been prepared in accordance with legal requirements designed to promote the independence of investment research.
No representation or warranty, express or implied, is given by any person as to the accuracy or completeness of the information and no responsibility or liability is accepted for the accuracy or sufficiency of any of the information, for any errors, omissions or misstatements, negligent or otherwise. Any views and opinions, whilst given in good faith, are subject to change without notice.
This is not an official confirmation of terms and is not to be taken as advice to take any action in relation to any investment mentioned herein. Any prices or quotations contained herein are indicative only.
Kepler Partners LLP (including its partners, employees and representatives) or a connected person may have positions in or options on the securities detailed in this report, and may buy, sell or offer to purchase or sell such securities from time to time, but will at all times be subject to restrictions imposed by the firm's internal rules. A copy of the firm's conflict of interest policy is available on request.
Past performance is not necessarily a guide to the future. The value of investments can fall as well as rise and you may get back less than you invested when you decide to sell your investments. It is strongly recommended that Independent financial advice should be taken before entering into any financial transaction.
PLEASE SEE ALSO OUR TERMS AND CONDITIONS
Kepler Partners LLP is a limited liability partnership registered in England and Wales at 9/10 Savile Row, London W1S 3PF with registered number OC334771.
Kepler Partners LLP is authorised and regulated by the Financial Conduct Authority.
These articles are provided for information purposes only. Occasionally, an opinion about whether to buy or sell a specific investment may be provided by third parties. The content is not intended to be a personal recommendation to buy or sell any financial instrument or product, or to adopt any investment strategy as it is not provided based on an assessment of your investing knowledge and experience, your financial situation or your investment objectives. The value of your investments, and the income derived from them, may go down as well as up. You may not get back all the money that you invest. The investments referred to in this article may not be suitable for all investors, and if in doubt, an investor should seek advice from a qualified investment adviser.
Full performance can be found on the company or index summary page on the interactive investor website. Simply click on the company's or index name highlighted in the article.