ii investment performance review: Q2 2025
The quarter began with a sell-off following Donald Trump’s tariff announcements, and geopolitical tensions continued in the Middle East as Israel attacked Iran.
14th July 2025 11:44

Market round-up
Heightened levels of volatility carried into Q2 as April kicked off with a sharp global market sell-off due to the announcement of the “Liberation Day” tariffs on 2 April from which almost no countries were spared. The S&P 500 index fell (-10.68%) between 3-8 April before a climbdown by the Trump administration (the 90-day pause to allow for negotiations), which pacified investors and resulted in a recovery.
- Our Services: SIPP Account | Stocks & Shares ISA | See all Investment Accounts
Over this time, US 10-year treasuries initially saw yields fall (prices rose) to 3.99% as investors sought to derisk. However, this was short-lived as 10-year yields subsequently jumped 50 basis points to 4.49% between 4-11April due to concerns over the inflationary impacts of tariffs, further trade war escalations, recessionary fears and declining confidence in the US.
In fixed-income markets, attention soon turned to US debt sustainability as the “big, beautiful bill”, which was eventually passed on 3 July is expected to add at least $3 trillion to the Federal debt pile over the next 10 years, causing a steepening of the yield curve. Moody’s had also cut its US sovereign debt rating to Aa1 in Q2 citing an increase in government debt and a rise in interest costs.
Geopolitical tensions continued to flare in the Middle East as the conflict spilled out into Iran.
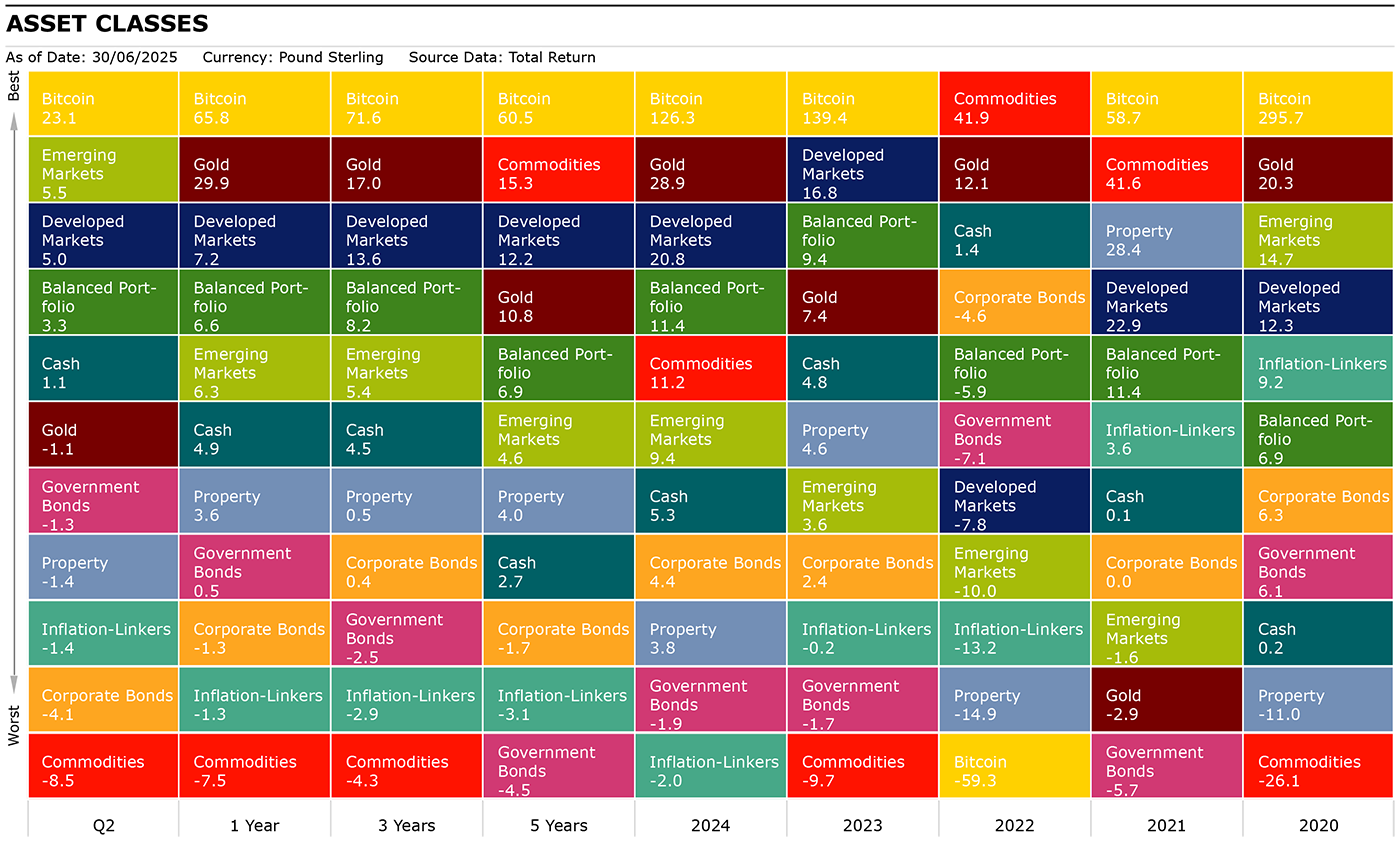
Source: Morningstar as of 30 June 2025. Total Returns in GBP. Developed Markets: MSCI World, Emerging Markets: MSCI EM, Corporate Bonds: Bloomberg Global Aggregate Corporate, Commodities: S&P GSCI, Property: FTSE EPRA Nareit Developed, Inflation-Linkers: Bloomberg Global Inflation Linked, Government Bonds: Bloomberg Global Treasury, Bitcoin: S&P Bitcoin, Balanced Portfolio: FTSE UK Private Investor Balanced, Cash: SONIA Lending Rate, Gold : LBMA Gold Price.
Shares
The MSCI ACWI rose (5.05%) over the quarter despite heightened levels of volatility as a result of US tariffs on the rest of the globe and the subsequent (temporary) climbdown. Emerging markets pipped developed markets, as they returned (5.48%) and (5.00%) respectively.
The S&P 500 rose (4.50%) over the quarter with IT (16.46%) and communications services (11.53%) seeing double-digit Q2 returns after a dismal start to 2025, a renewal of risk appetite and solid corporate earnings helped boost the mega-cap tech names.
Meanwhile, energy (-14.10%) and healthcare (-12.70%) lagged, with energy suffering from lower oil prices due to OPEC+ overproduction and the Trump administration looking to lower drug prices in the US putting downward pressure on share prices for the latter.
UK equities also saw positive returns (4.39%) despite higher exposure to the energy sector, which was the worst-performing sector as it fell (-10.20%) in the quarter. Healthcare also saw a negative return, falling (-6.75%).
All other sectors saw positive returns with industrials (16.99%), telecoms (11.93%) and utilities (10.86%) leading the way with double-digit returns. Industrials were boosted by defence stocks, which continues to attract flows with NATO members agreeing to increase defence spending.
European equities outperformed with the MSCI Europe ex-UK Index climbing (5.64%) in the quarter. As in the UK market, industrials (11.79%) did well as defence continued to be in the spotlight.
Other contributing sectors included utilities (12.24%), IT (11.04%) and communications services (10.08%), while energy (-5.33%), healthcare (-2.50%) and consumer discretionary (-1.86%) were the biggest drags to performance.
- Why Warren Buffett could back Britain in final mega-deal
- Sign up to our free newsletter for share, fund and trust ideas, and the latest news and analysis
In Japan, the TOPIX saw a (4.85%) rise in Q2 with the largest contributors being machinery (15.72%), IT and services (12.98%) and retail (9.62%), while energy (-8.95%), banks (-3.33%) and auto & transport equipment (-2.88%) lagged.
The MSCI Emerging Markets Index rose (5.48%) with South Korea rising (25%) as a period of political turmoil ended following the election of Lee Jae-myung as president in June. Lee’s policies include corporate governance reforms similar to those seen in Japan.
Taiwan also saw strong returns as it rose (18.77%) in the quarter as investors renewed their interest in artificial intelligence (AI) following the pause in the implementation of US tariffs.
Meanwhile, index heavyweights in China and India, lagged broad emerging markets having returned (-3.92%) and (2.88%) respectively. From an emerging markets sector perspective, IT (17.03%) and industrials (14.72%) led the way, while consumer discretionary (-8.37%) was the main detractor from performance.
| Q2 | YTD | 1 year | 3 years | 5 years | |
| FTSE All Share | 4.39 | 9.09 | 11.16 | 10.66 | 10.84 |
| FTSE 100 | 3.19 | 9.50 | 11.30 | 11.07 | 11.33 |
| FTSE 250 | 12.52 | 6.86 | 10.25 | 8.56 | 7.84 |
| FTSE Small Cap | 11.82 | 7.14 | 11.15 | 8.82 | 11.09 |
| Europe Ex UK | 5.64 | 13.49 | 8.76 | 13.20 | 9.58 |
| S&P 500 | 4.50 | -2.94 | 6.23 | 14.99 | 14.25 |
| Asia Pacific Ex Japan | 6.26 | 4.26 | 6.86 | 5.37 | 4.92 |
| TOPIX Japan | 4.85 | 3.24 | 6.94 | 11.05 | 6.80 |
| Emerging Markets | 5.48 | 5.34 | 6.35 | 5.37 | 4.62 |
| Brazil | 6.72 | 18.10 | 2.97 | 5.84 | 6.28 |
| China | -3.92 | 7.23 | 23.40 | -1.00 | -3.02 |
| India | 2.88 | -3.13 | -6.97 | 11.08 | 15.73 |
| World | 5.00 | 0.05 | 7.24 | 13.64 | 12.20 |
| MSCI ACWI | 5.05 | 0.58 | 7.16 | 12.72 | 11.32 |
| World Growth | 10.84 | -0.79 | 7.55 | 18.17 | 12.73 |
| World Value | -0.74 | 0.95 | 6.95 | 9.00 | 11.15 |
Source: Morningstar as of 30 June 2025. Total Returns in GBP. MSCI ACWI World Indexes. Past performance is not a guide to future performance.
Sectors/Style
Stylistically, global growth rose (10.84%), while global value was flat (-0.74%) over Q2 with the typical growth sectors such as IT (16.13%) and communications services (10.93%) doing particularly well as investors took on risky assets as tariffs were suspended. As alluded to already in the previous section, the biggest laggards were energy (-9.35%) and healthcare (-9.28%).
From a size perspective, global small-caps (5.84%) led large-caps (5.07%) and mid-cap (4.96%) peers although this was not consistent across regions, notably in the US where large-caps (5.29%) outshone small (1.90%) and mid-caps (1.40%). In Japan, mid-caps (5.90%) outperformed small (5.16%) and large-caps (4.41%).
| Q2 | YTD | 1 year | 3 years | 5 years | |
| Consumer Discretionary | 2.39 | -8.20 | 6.87 | 10.11 | 7.16 |
| Healthcare | -9.28 | -7.62 | -12.26 | -0.45 | 3.41 |
| Industrials | 8.62 | 7.72 | 13.94 | 16.41 | 13.54 |
| Information Technology | 16.13 | -0.44 | 5.95 | 23.46 | 17.33 |
| Materials | 0.13 | 1.76 | -4.32 | 2.96 | 6.78 |
| Utilities | 1.81 | 5.25 | 13.00 | 5.18 | 6.99 |
| Consumer Staples | -2.54 | -0.11 | 2.42 | 2.37 | 4.67 |
| Financials | 4.01 | 7.00 | 22.69 | 17.04 | 16.42 |
| Energy | -9.35 | -3.96 | -9.22 | 4.82 | 14.62 |
| Communication Services | 10.93 | 4.94 | 15.75 | 17.57 | 10.50 |
Source: Morningstar as of 30 June 2025. Total Returns in GBP. MSCI ACWI World Indexes. Past performance is not a guide to future performance.
Fixed income
The Bloomberg Global Aggregate Index fell (-1.55%) over the quarter. Global corporates (-4.1%) fared worse than global treasuries (-1.26%). In the UK, corporates outperformed as they rose (2.70%), while gilts rose (1.94%.)
Global credit spreads widened sharply in the initial aftermath of the Liberation Day tariffs as it threatened the global economic outlook. However, spreads quickly narrowed and closed the quarter at levels slightly lower than pre-tariffs as the White House announced a 90-day pause to allow for negotiations. On top of this, corporates were further supported by strong earnings in Q1.
The focus on tariffs soon made way for Trump’s “big, beautiful bill”, which is expected to add at least $3 trillion to US Federal debt over the next decade, with investors becoming increasingly concerned over US debt sustainability. In response, US 30-year treasury yields increased by over 20bps in Q2 from 4.52% to 4.78% in addition to breaching 5.00% during the quarter.
Over the quarter, the Federal Reserve opted to hold the Fed Funds Rate at 4.25% - 4.50% as uncertainty over tariffs remained. This contrasts with the European Central Bank, which cut rates twice in Q2, from 2.50% to 2.00% as inflation in the eurozone was broadly on target and growth remained fragile.
In the UK, the Bank of England cut its base rate just once in Q2 from 4.50% to 4.25% as inflation remained persistently above target, with the May reading coming in at 3.40%.
| Q2 | YTD | 1 year | 3 years | 5 years | |
| Global Aggregate | -1.55 | -1.96 | 0.46 | -1.31 | -3.18 |
| Global Government | -1.26 | -1.71 | 0.54 | -2.48 | -4.45 |
| UK gilts | 1.94 | 2.50 | 1.63 | -3.07 | -5.90 |
| Global Corporate | -4.08 | -4.75 | -1.25 | 0.39 | -1.68 |
| Sterling Corporate | 2.70 | 3.45 | 5.33 | 2.39 | -0.97 |
| EURO Corporate | 4.13 | 5.49 | 7.07 | 3.95 | -0.85 |
| Global Inflation Linked | -1.39 | -1.05 | -1.27 | -2.89 | -3.10 |
| UK Inflation Linked | 0.85 | -0.63 | -5.14 | -8.10 | -9.23 |
| Global High Yield | -1.20 | -2.37 | 4.28 | 7.37 | 3.49 |
Source: Morningstar as of 30 June 2025. Total Returns in GBP. Global Aggregate: Bloomberg Global Aggregate, Global Government: Bloomberg Global Treasury, UK Gilts: FTSE Act UK Conventional Gilts All Stocks. Global Corporate: Bloomberg Global Corporate, Sterling Corporate: ICE BofA Sterling Non-Gilt, Euro Corporate: Markit iBoxx EUR, Global High Yield: Bloomberg Global High Yield, Global Inflation Linked: Bloomberg Global Inflation Linked, UK Inflation Linked: Bloomberg Global Inflation Linked UK.
Alternatives
The S&P GSCI fell (-8.46%) over the quarter as all major components of the index saw negative returns except livestock, which rose (2.18%). The worst-performing components were energy (-11.95%) and agriculture (-10.78%).
Energy declined due to increased production from OPEC+ with further planned production increases in July, although flaring geopolitical tensions in the Middle East caused a brief spike in oil prices. Within energy, all sub-components saw negative returns with natural gas (-30.59%) and Brent crude (-15.92%) being the largest detractors.
Within agriculture, all sub-components except cocoa saw negative returns with coffee (-23.80%), sugar (-19.24%) and corn (-13.60%) being the major drivers of negative returns.
| Q2 | YTD | 1 year | 3 years | 5 years | |
| Global REITs | -1.36 | -2.52 | 3.64 | 0.48 | 3.96 |
| UK REITs | 9.63 | 11.84 | 1.19 | -2.70 | 1.24 |
| Gold | -1.07 | 14.72 | 29.88 | 17.00 | 10.79 |
| Global Infrastructure | 3.98 | 5.54 | 17.84 | 8.07 | 10.80 |
| Global Natural Resources | -2.59 | 1.25 | -6.62 | 1.58 | 10.39 |
| Volatility | -29.27 | -11.87 | 24.06 | -19.77 | -13.09 |
| Cash | 1.10 | 2.25 | 4.86 | 4.48 | 2.75 |
| Commodity | -8.46 | -6.84 | -7.52 | -4.30 | 15.28 |
| Brent crude oil | -15.92 | -18.28 | -27.57 | -18.44 | 7.84 |
| Energy | -11.95 | -10.45 | -14.71 | -7.64 | 19.62 |
| Bitcoin | 23.11 | 5.45 | 65.80 | 71.61 | 60.47 |
Source: Morningstar as of 30 June 2025. Total Returns in GBP. Global REITS: FTSE EPRA Nareit Developed, UK REITs: FTSE EPRA Nareit UK, Gold: LBMA Gold Price AM, Oil: Oil Price Brent Crude, Global Infrastructure: S&P Global Infrastructure, Natural Resources: S&P Global Natural Resources, Commodities: S&P GSCI , Energy : S&P GSCI,Volatility: CBOE Market Volatility (VIX), Cash: SONIA Lending Rate, Bitcoin: S&P Bitcoin
Most-traded shares on the ii platform in Q2 2025
Most-bought shares
| BP (LSE:BP.) |
| Rolls-Royce Holdings (LSE:RR.) |
| Legal & General Group (LSE:LGEN) |
| NVIDIA Corp (NASDAQ:NVDA) |
| Tesla Inc (NASDAQ:TSLA) |
Most-sold shares
These articles are provided for information purposes only. Occasionally, an opinion about whether to buy or sell a specific investment may be provided by third parties. The content is not intended to be a personal recommendation to buy or sell any financial instrument or product, or to adopt any investment strategy as it is not provided based on an assessment of your investing knowledge and experience, your financial situation or your investment objectives. The value of your investments, and the income derived from them, may go down as well as up. You may not get back all the money that you invest. The investments referred to in this article may not be suitable for all investors, and if in doubt, an investor should seek advice from a qualified investment adviser.
Full performance can be found on the company or index summary page on the interactive investor website. Simply click on the company's or index name highlighted in the article.