Iran war 100 days: how stocks and markets have performed
It’s been over three months since President Trump and Israel staged a joint military attack on Iran. Graeme Evans reveals what conflict has done to financial markets.
8th June 2026 15:15
by Graeme Evans from interactive investor
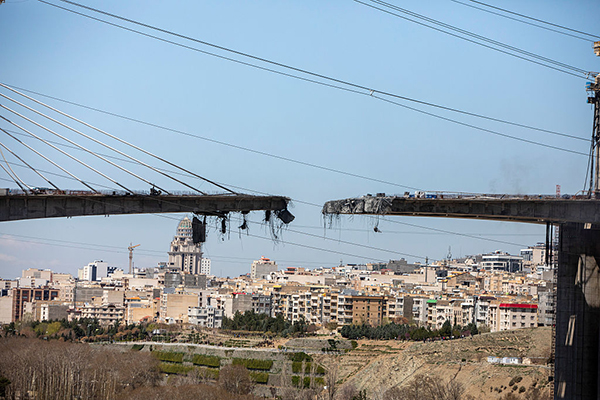
A view of a bridge west of Tehran in Karaj, a day after it was destroyed by an airstrike in April 2026. Photo: Majid Saeedi/Getty Images.
Falls of 10% or more for Aviva (LSE:AV.), AstraZeneca (LSE:AZN) and Imperial Brands (LSE:IMB) compare with the record run of NVIDIA Corp (NASDAQ:NVDA) as tech stocks provided investors with shelter in the first 100 days of the Iran war.
- Our Services: SIPP Account | Stocks & Shares ISA | See all Investment Accounts
The “old economy” exposure of the UK stock market meant the FTSE 100 index started Monday’s session down by 5% versus its level prior to the start of the conflict on 27 February, whereas the Nasdaq 100 rose 16% and the S&P 500 index lifted 7%.
A recovery of 5% since the low point of 23 March, which was aided by April’s ceasefire and the stronger performance of Barclays (LSE:BARC) and HSBC Holdings (LSE:HSBA), has limited some of the FTSE 100 downside.
Yet, this resilient showing of recent weeks has been put in the shade by the 29.3% bounce of Japan’s Nikkei 225 and 20% surge of the Nasdaq as the global AI trade gathered pace.
| Name | Price | Past 100 days (%) | Since wartime low (%) | 1 month change (%) | 2026 (%) |
| NASDAQ 100 | 28957.6 | 16.0 | 19.7 | -0.9 | 14.7 |
| NASDAQ Composite | 25709.4 | 13.4 | 17.1 | -2.1 | 10.6 |
| Nikkei 225 | 66588.1 | 13.1 | 29.3 | 6.2 | 32.3 |
| S&P 500 | 7383.74 | 7.3 | 12.2 | -0.2 | 7.9 |
| Dow Jones | 50866.8 | 3.9 | 10.1 | 2.5 | 5.8 |
| FTSE AIM UK 50 | 4042.72 | -1.3 | 12.3 | -1.2 | 2.3 |
| DAX Xetra (Germany) | 24759.1 | -2.1 | 9.3 | 1.7 | 1.1 |
| FTSE AIM All-Share | 797.27 | -2.7 | 11.8 | -2.1 | 4.1 |
| FTSE 250 | 23060.7 | -2.9 | 8.5 | 0.9 | 2.6 |
| SSE Composite (Shanghai) | 4027.74 | -3.3 | 5.6 | -3.6 | 1.5 |
| CAC 40 (Paris) | 8218.24 | -4.2 | 6.4 | 1.3 | 0.8 |
| Swiss Market Index | 13388.2 | -4.5 | 8.1 | 2.2 | 0.8 |
| FTSE All-Share | 5574.09 | -4.7 | 5.2 | 1.3 | 4.2 |
| FTSE 350 | 5636 | -4.8 | 5.2 | 1.3 | 4.2 |
| FTSE 100 | 10368 | -5.0 | 4.8 | 1.3 | 4.4 |
| Bovespa Stock Index (Brazil) | 169019 | -5.7 | -7.1 | -8.2 | 4.9 |
| S&P BSE 100 Index (Mumbai) | 24847.8 | -6.1 | 5.3 | -3.3 | -9.1 |
| Hang Seng (Hong Kong) | 24553 | -7.8 | 0.7 | -7.0 | -4.2 |
Source: ShareScope. War-time low was 23 March 2026. Past performance is not a guide to future performance.
The tech theme also supported the FTSE 250 index, where big gains for Raspberry Pi Holdings (LSE:RPI), Computacenter (LSE:CCC) and Softcat (LSE:SCT) helped the mid-cap to rally by 8.5% over the period since 23 March for a decline of 2.9% across the 100 days of the war.
The AIM 100 has also outperformed the FTSE 100 index as the doubling of value by space industry supplier Filtronic (LSE:FTC) and the green energy firm ITM Power (LSE:ITM) meant the junior market rallied 11.3% since 23 March for a decline of 4.3% across the duration of the conflict.
- 10 hottest ISA shares, funds and trusts: week ended 5 June 2026
- Insider: FTSE 250 pair present buying opportunity
The war-time resilience of global markets, as seen by a rise of 3.9% for the Dow Jones Industrial Average and flat performance by the Euronext 100, has come even though the price of a barrel Brent crude is still 28% more expensive than at the end of February.
The elevated level due to the prolonged closure of the Strait of Hormuz means investors are now braced for interest rate hikes in Europe and the US.
The rate rise expectations have kept benchmark government bond yields well above pre-conflict levels, particularly in the UK after 10-year gilts topped 5% for the first time since 2008.
That’s weighed on prices across the London stock market, particularly the housebuilding sector as Persimmon (LSE:PSN) and Barratt Redrow (LSE:BTRW) have lost 30% of their value since the war began.
Affordability fears after the average mortgage rate recorded by Moneyfacts rose from 4.89% at the start of March to Friday’s 5.58% have also contributed to Vistry Group (LSE:VTY) shares being down by 63% and Bellway (LSE:BWY) 35% cheaper in the FTSE 250.
- Stockwatch: a blue-chip with long-term recovery potential
- Share Sleuth: the firm I’ve bought again despite a pricey valuation
The squeeze on household budgets, coupled with margin pressure caused by higher shipping and other input costs, triggered a de-rating of Reckitt Benckiser Group (LSE:RKT) and Unilever (LSE:ULVR) after their shares fell by 30% and 23% respectively.
Investors also dumped B&Q owner Kingfisher (LSE:KGF) and kitchens supplier Howden Joinery Group (LSE:HWDN), leaving them among the dozen FTSE 100 stocks down by 20% or more since the conflict began.
The others include precious metal miners Fresnillo (LSE:FRES) and Endeavour Mining (LSE:EDV) after bets on US interest rate rises caused the price of non-yielding gold to fall back from record levels.
The biggest decline in the FTSE 100 index since the start of the war has been by the 3i Group Ord (LSE:III) as a slowdown in like-for-like sales growth at European discount chain Action fuelled City concerns about 3i’s reliance on an asset that accounts for 70% of its portfolio.
A post-results fall for Babcock International Group (LSE:BAB) means the defence group completes the dozen-strong list of big FTSE 100 fallers, alongside Weir Group (LSE:WEIR) and Convatec Group (LSE:CTEC).
| FTSE 100 company | Price | Past 100 days (%) | Since wartime low (%) | 1 month change (%) | 2026 (%) |
| 3i Group Ord (LSE:III) | 2209p | -33.5 | -17.9 | -14.7 | -32.3 |
| Weir Group (LSE:WEIR) | 2372p | -32.7 | -14.0 | -5.1 | -16.7 |
| Reckitt Benckiser Group (LSE:RKT) | 4549p | -30.1 | -10.5 | -2.6 | -24.2 |
| Fresnillo (LSE:FRES) | 2986p | -29.6 | -5.7 | -16.4 | -10.4 |
| Persimmon (LSE:PSN) | 1068.5p | -29.1 | -6.5 | -4.0 | -21.3 |
| Barratt Redrow (LSE:BTRW) | 259.6p | -28.9 | -2.8 | -1.4 | -31.9 |
| Endeavour Mining (LSE:EDV) | 3975p | -24.9 | -0.5 | -17.1 | 2.7 |
| Babcock International Group (LSE:BAB) | 1035p | -23.4 | -18.5 | -1.7 | -16.7 |
| Unilever (LSE:ULVR) | 4188.5p | -23.4 | -7.6 | -2.0 | -13.8 |
| Kingfisher (LSE:KGF) | 284.1p | -23.3 | -4.2 | -1.5 | -9.2 |
Source: ShareScope. War-time low was 23 March 2026. Past performance is not a guide to future performance.
Another 20 stocks were down by between 10% and 20% since the start of the conflict, including heavyweights Aviva, National Grid (LSE:NG.), AstraZeneca and GSK (LSE:GSK) with declines in the region of 12%.
Rolls-Royce Holdings (LSE:RR.) opened Monday’s session 5.5% lower since the war started at 1,260p, having fallen from a record 1,363p in early March to a low of 1,106p at the end of that month.
One of the standout performances has been by International Consolidated Airlines Group SA (LSE:IAG) given that shares have withstood higher jet fuel cost and Middle East airspace disruption to trade broadly unchanged at 420.8p. That follows a 16% bounce since 23 March.
Unsurprisingly, the jump in Brent crude to as high as $114 a barrel ensured that BP (LSE:BP.) and Shell (LSE:SHEL) were among the 31 FTSE 100 index stocks in positive territory over the war-time period.
- How much do you need to secure a comfortable retirement?
- Sign up to our free newsletter for investment ideas, latest news and award-winning analysis
The boost for BP’s balance sheet deleveraging lifted its shares by 14.3%, although recent boardroom upheaval and Brent crude’s return below $100 a barrel have caused the shares to fall from 600p at the end of March to Monday morning’s 546p.
A reduction in Shell’s quarterly buyback programme to $3 billion also limited the upside for its shares to 5%, including a fall of 3.8% since 23 March.
Glencore (LSE:GLEN) was the best performing of the diversified miners after Middle East disruption caused power generators to switch from gas to coal use.
The company is the world’s largest seaborne thermal coal exporter, with a 17-month high for the price of Newcastle coal helping shares to rise 11% to 590.2p during the war.
Quality compounders fared well in the FTSE 100, led by Diploma (LSE:DPLM) after the controls, seals and life sciences business bolstered guidance for a second time this year. Its shares rose 24%, which compared with 11.5% for safety technology conglomerate Halma (LSE:HLMA).
- Don’t write off UK stocks: two undervalued FTSE 100 shares
- Stockwatch: are Diageo shares really a recovery play?
They were joined by Pearson (LSE:PSON), whose shares jumped 21% as improved tech sentiment helped investors return to some of the stocks hit by AI disruption fears earlier in the year. They included London Stock Exchange Group (LSE:LSEG) and Sage Group (The) (LSE:SGE) after gains of 6%.
Polar Capital Technology Ord (LSE:PCT) and Scottish Mortgage Ord (LSE:SMT), which includes the semiconductor firms ASML Holding NV (EURONEXT:ASML), Taiwan Semiconductor Manufacturing Co Ltd ADR (NYSE:TSM) and Nvidia in its portfolio, rose by 34% and 20% respectively as they reaped the benefit of Wall Street’s AI-fuelled gains.
| FTSE 100 company | Price | Past 100 days (%) | Since wartime low (%) | 1 month change (%) | 2026 (%) |
| Polar Capital Technology Ord (LSE:PCT) | 1839p | 41.4 | 29.2 | 20.4 | 39.8 |
| Polar Capital Technology Ord (LSE:PCT) | 684p | 33.9 | 39.0 | 3.7 | 47.4 |
| Diploma (LSE:DPLM) | 7020p | 23.7 | 20.4 | 1.1 | 32.6 |
| Pearson (LSE:PSON) | 1159.5p | 20.8 | 22.3 | 6.2 | 10.4 |
| Scottish Mortgage Ord (LSE:SMT) | 1480p | 19.6 | 27.0 | 3.3 | 24.8 |
| InterContinental Hotels Group (LSE:IHG) | 16180¢ | 17.7 | 23.2 | 8.1 | 15.0 |
| DCC (LSE:DCC) | 6015p | 16.0 | 33.0 | 4.6 | 29.9 |
| Intertek Group (LSE:ITRK) | 5455p | 15.5 | 49.9 | 11.1 | 17.9 |
| BP (LSE:BP.) | 546p | 14.3 | 1.4 | 1.9 | 26.2 |
| Bunzl (LSE:BNZL) | 2470p | 12.6 | 13.8 | 3.2 | 19.0 |
Source: ShareScope. Wartime low was 23 March 2026. Past performance is not a guide to future performance.
Nine consecutive positive weeks culminated in the S&P 500 index setting a record above 7,600 on 2 June, representing an improvement of 1,000 points on the level at the end of March.
Nvidia lifted 16% during a strong run that included a record high on 14 May, while Advanced Micro Devices Inc (NASDAQ:AMD), Dell Technologies Inc Ordinary Shares - Class C (NYSE:DELL), Intel Corp (NASDAQ:INTC) and Micron Technology Inc (NASDAQ:MU) were among eight S&P 500 to double in value despite the start of the Iran war.
- Three advantages retail investors have over the professionals
- Tech Focus: Alphabet, Anthropic, Nvidia, Marvell, Oracle
Big fallers over that period were Nike Inc Class B (NYSE:NKE) and Lululemon Athletica Inc (NASDAQ:LULU) following declines of 30% and 38% respectively.
| S&P 500 company | Price | Past 100 days (%) | Since wartime low (%) | 1 month change (%) | 2026 (%) |
| Dell Technologies Inc Ordinary Shares - Class C (NYSE:DELL) | 39464¢ | 167.0 | 140.0 | 51.6 | 214.0 |
| SanDisk Corp Ordinary Shares (NASDAQ:SNDK) | 155932¢ | 145.0 | 122.0 | -0.2 | 557.0 |
| Advanced Micro Devices Inc (NASDAQ:AMD) | 46638¢ | 133.0 | 130.0 | 2.5 | 118.0 |
| Hewlett Packard Enterprise Co (NYSE:HPE) | 4913¢ | 129.0 | 120.0 | 56.8 | 105.0 |
| Intel Corp (NASDAQ:INTC) | 9917¢ | 117.0 | 125.0 | -20.6 | 169.0 |
| Micron Technology Inc (NASDAQ:MU) | 86401¢ | 110.0 | 114.0 | 15.7 | 203.0 |
| Datadog Inc Class A (NASDAQ:DDOG) | 23411¢ | 109.0 | 81.2 | 17.0 | 72.2 |
| Seagate Technology Holdings (NASDAQ:STX) | 84747¢ | 108.0 | 110.0 | 8.3 | 208.0 |
| Humana Inc (NYSE:HUM) | 35111¢ | 84.2 | 106.0 | 27.7 | 37.0 |
| Fortinet Inc (NASDAQ:FTNT) | 14468¢ | 83.1 | 74.8 | 26.8 | 82.2 |
Source: ShareScope. Wartime low was 23 March 2026. Past performance is not a guide to future performance.
AIM stocks tend to be volatile high-risk/high-reward investments and are intended for people with an appropriate degree of equity trading knowledge and experience.
These articles are provided for information purposes only. Occasionally, an opinion about whether to buy or sell a specific investment may be provided by third parties. The content is not intended to be a personal recommendation to buy or sell any financial instrument or product, or to adopt any investment strategy as it is not provided based on an assessment of your investing knowledge and experience, your financial situation or your investment objectives. The value of your investments, and the income derived from them, may go down as well as up. You may not get back all the money that you invest. The investments referred to in this article may not be suitable for all investors, and if in doubt, an investor should seek advice from a qualified investment adviser.
Full performance can be found on the company or index summary page on the interactive investor website. Simply click on the company's or index name highlighted in the article.