Less is more: the trusts that outperformed during the sell-off
Data shows the trend of investment trusts moving to more concentrated portfolios is a good thing.
7th August 2020 15:20
This content is provided by Kepler Trust Intelligence, an investment trust focused website for private and professional investors. Kepler Trust Intelligence is a third-party supplier and not part of interactive investor. It is provided for information only and does not constitute a personal recommendation.
Material produced by Kepler Trust Intelligence should be considered a marketing communication, and is not independent research.
Data shows the trend of investment trusts moving to more concentrated portfolios is a good thing for investors.

William Sobczak is an analyst at Kepler Trust Intelligence.
Recipe for disaster?
There is some evidence that, in recent years, the rise of passive funds has caused investment managers to become increasingly concentrated, endeavouring to be considered active managers as opposed to ‘closet trackers’.
The most active trusts tend to generate the highest levels of alpha, as we have often noted, and on average managers have been decreasing their number of holdings in the hope of achieving this.
Academic support for taking this approach has been provided by Martin Cremers and Antti Petajisto, who have shown evidence that portfolios with higher 'active share' tend to beat their benchmark net of fees whereas the least active tend to match their benchmark index performance before fees, and under-perform after fees.
In this article we assess how the trusts that have been increasing their concentration have performed in the most recent market corrections.
We then assess the performance of the most concentrated trusts, including investors in both small and large-caps, through the COVID-19 crash, and compare how they have done relative to the broader investment trust universe and their peers. Our research shows that more concentrated funds are not necessarily more susceptible to underperformance in a falling market.
How does concentration impact your performance during a downturn?
The past three years have seen three corrections or near corrections in the MSCI ACWI index. The first was between 11/01/18 and 26/03/18, which saw a 9% fall across the MSCI ACWI.
Then in the periods 02/10/18 – 21/12/18 and 20/02/20 – 18/03/20 the same market saw greater than 10% falls. Over the past five years 15 trusts have, according to Morningstar data, decreased their number of holdings by at least 20 positions.
These can be seen in the table below, with the excess return over the benchmark they have generated in these periods of market drawdown.
As can be seen there is no clear pattern, in terms of performance, across the differing market corrections. Nine of the fifteen (60%) did worse on a relative basis in the most recent correction than they did in the January 2018 slump.
However, only seven of the fifteen (47%) did worse than in the Q4 2018 slump. On the other hand, only 6 managed to outperform their benchmark in the most recent correction compared to 10 in the first.
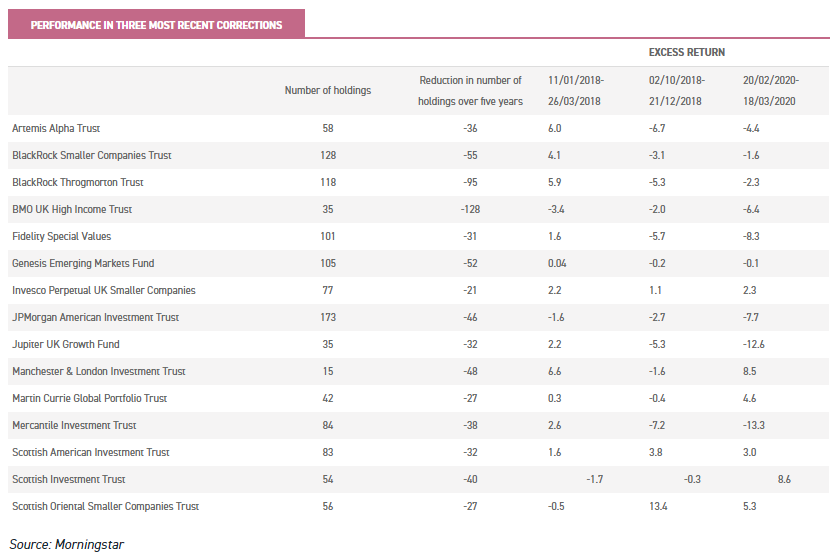
Scottish Investment Trust (LSE:SCIN) is the only trust of the sample to progressively improve its excess return through each correction.
2014 saw a shift to a ‘best ideas’ portfolio, with Alisdair Mckinnon taking over as manager. Subsequently to Alisdair taking the reins the board made a conscious decision to almost halve the size of its portfolio to the current level of 54 holdings.
Martin Currie Global Portfolio (LSE:MNP) is another trust to stand out in the most recent market correction, performing particularly strongly in the recent correction relative to the past two market falls. Again the trust saw a large shift in concentration after a manager change, with Zehrid Osmani taking over the portfolio in 2018. Over the past five years the portfolio has moved to having just 42 holdings, although it has gone as low as 30 in recent months.
However, looking across these trusts, only Manchester & London (LSE:MNL) would actually be generally considered to be highly concentrated in absolute terms with just 15 holdings. The large majority – although increasing concentration dramatically –are still reasonably diversified, with five of the 15 trusts having more than 100 holdings in their portfolios.
Therefore to look at the effect of concentration itself in the recent crash we think it is better to look at the most concentrated trusts across the wider universe.
In fact, if one looks at the most concentrated trusts in the investment trust universe, the performance during the most recent correction has, on average, been very strong.
The trusts with fewer than 30 holdings have generated an average excess return of 8.4% in the 2020 correction, relative to their respective benchmarks (see table below). In comparison the broader investment trust universe generated a negative excess return of -1.01% to their relevant benchmarks. On the other hand, the least concentrated trusts, those with over 100 holdings, had an average excess return of -2.01%.
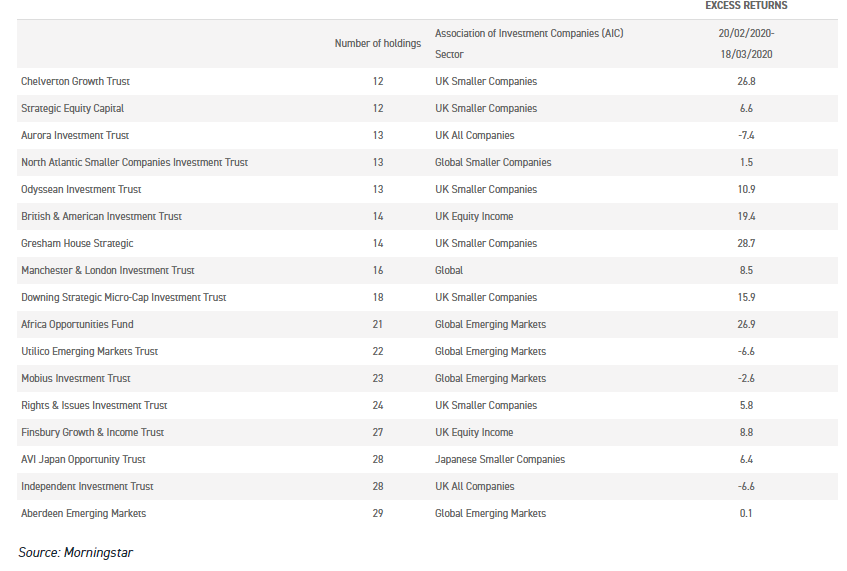
It is worth noting, however, that many of the most concentrated trusts (in the table above) hold smaller companies.
These trusts generally show stronger outperformance of their benchmarks than large-cap portfolios in any case, with the markets offering greater alpha potential. Moreover some of the trusts in the table hold micro-cap companies.
These are relatively illiquid and are unlikely to be traded during a sharp decline, meaning NAVs may not really reflect what market prices would be and so performance in corrections might be flattered.
Some also hold unlisted companies which are only valued monthly or quarterly. We think these factors are more likely to be important than concentration in explaining the outperformance in the table above.
Consequently we have restricted our analysis further to look only at large cap trusts to see if there has been any link between concentration and performance in downturns.
On average the 24 large-cap trusts with fewer than 50 holdings have an excess return of -0.08% in the 2020 correction. However the large-cap trusts with over 50 holdings have a negative excess return of -8.44%, i.e have generated significant underperformance.
Thus, there would not appear in our view to be a causal link between a reduced number of holdings and greater susceptibility to drawdowns.
Furthermore, if we look at the large cap trusts in comparison to their specific sectors, the most concentrated trusts have performed considerably better.
Below we have created a table with the average returns for the trusts with less than 50 holdings vs those with more than 50 holdings in each large cap sector. All but the Global Equity Income sector, which has just one trust with fewer than 50 holdings, has seen the more concentrated trusts outperform.
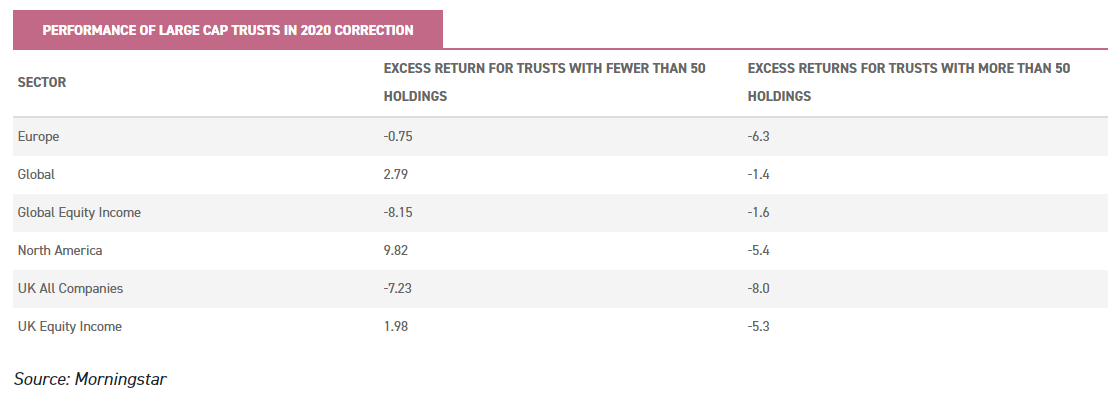
Similar to the Global Equity Income sector, we would opine that the results for North America need to be taken with a pinch of salt as there is such a small sample of trusts to look at. On the other hand it is worth highlighting the UK Equity Income sector. In this sector the nine trusts with fewer than 50 holdings have generated significant excess returns than the 16 with more than 50 holdings in a period with awful returns for the UK stock market.
Within this sector, British & American (LSE:BAF), Finsbury Growth & Income (LSE:FGT) and Troy Income & Growth (LSE:TIGT) have been particularly strong performers over the COVID-19 correction. TIGIT has a little under 50 holdings, whereas FGT and BA are extremely concentrated with 14 and 17 holdings respectively.
Conclusion
We believe this data shows that concentrated portfolios can continue to outperform during bear markets and concentration does not always mean increased losses.
Clearly there is not enough evidence yet to draw statistically significant conclusions, but we believe the indications are that investors should not be concerned about the downside loss potential of an investment trust purely if it is more concentrated than its peers.
In our view the trend to concentrated portfolios is a good thing for investors and likely to reinforce the benefits of investing actively through a closed-ended fund. This is because some of the drawbacks of concentration are more problematic for open-ended funds. The latter have to sell when they are suffering outflows, which incentivises them to hold more stocks, either to counter-balance illiquid holdings or to guard against the risk of any one becoming illiquid in a crisis.
Kepler Partners is a third-party supplier and not part of interactive investor. Neither Kepler Partners or interactive investor will be responsible for any losses that may be incurred as a result of a trading idea.
These articles are provided for information purposes only. Occasionally, an opinion about whether to buy or sell a specific investment may be provided by third parties. The content is not intended to be a personal recommendation to buy or sell any financial instrument or product, or to adopt any investment strategy as it is not provided based on an assessment of your investing knowledge and experience, your financial situation or your investment objectives. The value of your investments, and the income derived from them, may go down as well as up. You may not get back all the money that you invest. The investments referred to in this article may not be suitable for all investors, and if in doubt, an investor should seek advice from a qualified investment adviser.
Full performance can be found on the company or index summary page on the interactive investor website. Simply click on the company's or index name highlighted in the article.
Important Information
Kepler Partners is not authorised to make recommendations to Retail Clients. This report is based on factual information only, and is solely for information purposes only and any views contained in it must not be construed as investment or tax advice or a recommendation to buy, sell or take any action in relation to any investment.
This report has been issued by Kepler Partners LLP solely for information purposes only and the views contained in it must not be construed as investment or tax advice or a recommendation to buy, sell or take any action in relation to any investment. If you are unclear about any of the information on this website or its suitability for you, please contact your financial or tax adviser, or an independent financial or tax adviser before making any investment or financial decisions.
The information provided on this website is not intended for distribution to, or use by, any person or entity in any jurisdiction or country where such distribution or use would be contrary to law or regulation or which would subject Kepler Partners LLP to any registration requirement within such jurisdiction or country. Persons who access this information are required to inform themselves and to comply with any such restrictions. In particular, this website is exclusively for non-US Persons. The information in this website is not for distribution to and does not constitute an offer to sell or the solicitation of any offer to buy any securities in the United States of America to or for the benefit of US Persons.
This is a marketing document, should be considered non-independent research and is subject to the rules in COBS 12.3 relating to such research. It has not been prepared in accordance with legal requirements designed to promote the independence of investment research.
No representation or warranty, express or implied, is given by any person as to the accuracy or completeness of the information and no responsibility or liability is accepted for the accuracy or sufficiency of any of the information, for any errors, omissions or misstatements, negligent or otherwise. Any views and opinions, whilst given in good faith, are subject to change without notice.
This is not an official confirmation of terms and is not to be taken as advice to take any action in relation to any investment mentioned herein. Any prices or quotations contained herein are indicative only.
Kepler Partners LLP (including its partners, employees and representatives) or a connected person may have positions in or options on the securities detailed in this report, and may buy, sell or offer to purchase or sell such securities from time to time, but will at all times be subject to restrictions imposed by the firm's internal rules. A copy of the firm's conflict of interest policy is available on request.
Past performance is not necessarily a guide to the future. The value of investments can fall as well as rise and you may get back less than you invested when you decide to sell your investments. It is strongly recommended that Independent financial advice should be taken before entering into any financial transaction.
PLEASE SEE ALSO OUR TERMS AND CONDITIONS
Kepler Partners LLP is a limited liability partnership registered in England and Wales at 9/10 Savile Row, London W1S 3PF with registered number OC334771.
Kepler Partners LLP is authorised and regulated by the Financial Conduct Authority.