New forecasts for Nasdaq, S&P, Dow Jones and Prudential
10th May 2022 07:09
by Alistair Strang from Trends and Targets
With the Nasdaq having lost over a quarter of its value in 2022, and other main markets floundering, independent analyst Alistair Strang reveals the numbers that investors should watch closely.

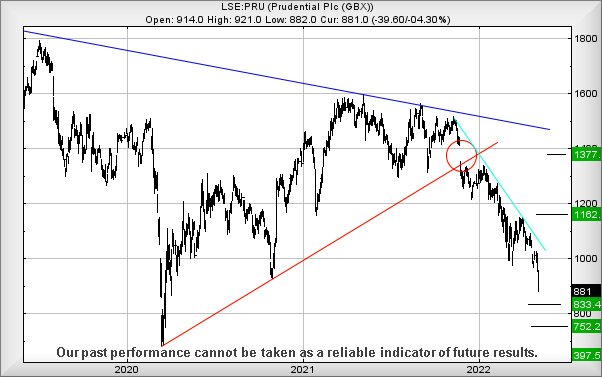
Prudential (LSE:PRU) provided a bit of a shock when we were asked to review the share. We reviewed Prudential in November 2014 when the price was around 1,300p and we gave a target level around an eventual 2,000p. It took years, reached target, and has been floundering a bit uncertainly since.
Circled on the chart is something peculiar which occurred last year, the share price quite deliberately gapped below the uptrend since 2020. This sort of thing tends to broadcast all the wrong signals (unless, of course, by some miracle the market opts to gap a price back above the trend. In which case, take a long position and wait!).
The provider of life and health insurance, focussed on Africa and Asia, look set for continued share price tumbles currently.
Below 882p projects the potential of reversal to an initial 833p. Should such a level break, our secondary calculation comes in at 752p. We’d normally hope for a proper rebound should 833p make an appearance, but closure below such a level makes our secondary almost essential to provide an excuse for a bounce. The problem comes if the price closes below our 752p secondary target as an ultimate bottom of 397p becomes dangerously viable.
Currently the share price needs exceed 1,085p just to suggest the immediate rate of descent has eased, entering a zone where a path to 1,377p works out as possible. For now, it doesn’t look like ‘Dear Prudence’ wants to come out to play.
Source: Trends and Targets. Past performance is not a guide to future performance
The US markets (DOW, S&P500, Nasdaq)
The league table of disaster on Monday was led by the Nasdaq, boasting a daily reversal at -4%. The S&P came second, down -3.2%, and the Dow Jones proved fairly half-hearted, only dropping by -2%.
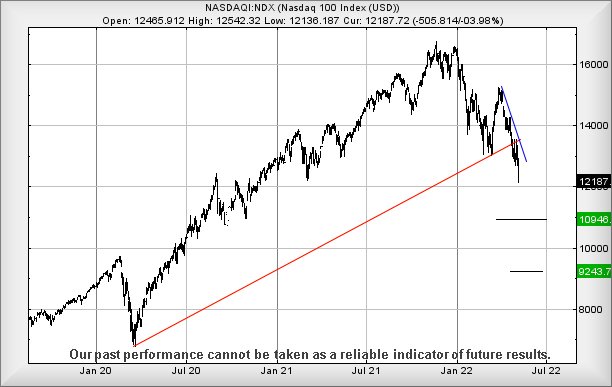
As the Nasdaq 100 index (currently at 12,187) has taken the lead in this calamity, we’re extremely interested if 12,130 points breaks anytime soon. Such a mess would remove logic which asked for a bounce, instead risking triggering ongoing reversals to an initial 10,946 with secondary, if broken, at 9,243 points. This level of trouble looks almost ridiculous, negating growth over the last year and visually dumping the index back to the level it enjoyed prior to the pandemic. The index requires to exceed 13,500 to cancel the logic pointing to this drop scenario.
Source: Trends and Targets. Past performance is not a guide to future performance
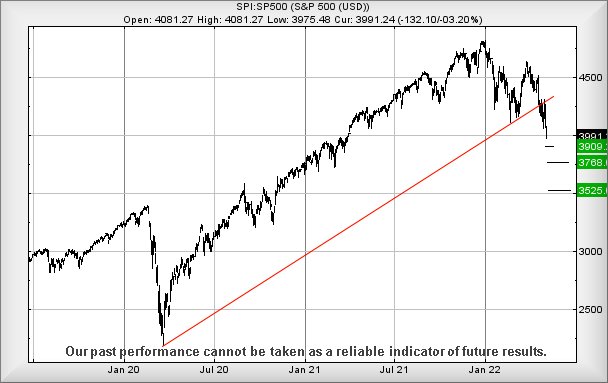
The S&P500 looks pretty painful, perhaps approaching a level where some sort of rebound can be hoped. Currently, below 3,975 threatens ongoing reversal to 3,909 points with secondary, if broken, at 3,768 points.
The market is required to exceed 4,270 just to get out of trouble and, in this instance, we can calculate a third level target at 3,525. This is just above the pre-pandemic high, creating a visually pleasing level hopefully capable of generating a trampoline moment.
Source: Trends and Targets. Past performance is not a guide to future performance
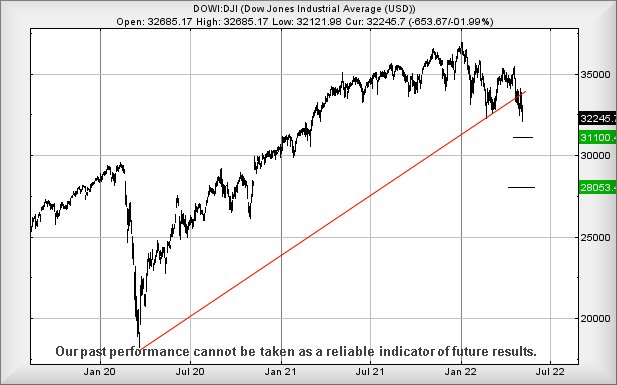
The Dow Jones is a bit of a puzzle. For some time we’ve been expecting the 31,000 level to make a guest appearance and now, despite the rest of the market being on fire, the index resisted the temptation.
Of course, with earnings season in full swing in the USA, there are liable to be plenty of mitigating circumstances avoiding an immediate rout. Glancing through headlines, the falls are being blamed on interest rate rise concerns, worries about market growth, Russia and oil prices.
Now below 32,100 points for Wall Street calculates with a hopeful bottom potential at 31,100 points. If broken, our secondary calculates down at an incredible 28,050 points but in this instance, we’re inclined to regard below 30,800 at a final trigger level down to the 28,000 level. This numbers have been muddied, thanks to the index being gapped down several times at the open of trade in recent days.
To start digging its way out of trouble, Wall Street needs miracle recovery above 33,700 to negate the reversal potentials.
Source: Trends and Targets. Past performance is not a guide to future performance
Alistair Strang has led high-profile and "top secret" software projects since the late 1970s and won the original John Logie Baird Award for inventors and innovators. After the financial crash, he wanted to know "how it worked" with a view to mimicking existing trading formulas and predicting what was coming next. His results speak for themselves as he continually refines the methodology.
Alistair Strang is a freelance contributor and not a direct employee of Interactive Investor. All correspondence is with Alistair Strang, who for these purposes is deemed a third-party supplier. Buying, selling and investing in shares is not without risk. Market and company movement will affect your performance and you may get back less than you invest. Neither Alistair Strang or Interactive Investor will be responsible for any losses that may be incurred as a result of following a trading idea.
These articles are provided for information purposes only. Occasionally, an opinion about whether to buy or sell a specific investment may be provided by third parties. The content is not intended to be a personal recommendation to buy or sell any financial instrument or product, or to adopt any investment strategy as it is not provided based on an assessment of your investing knowledge and experience, your financial situation or your investment objectives. The value of your investments, and the income derived from them, may go down as well as up. You may not get back all the money that you invest. The investments referred to in this article may not be suitable for all investors, and if in doubt, an investor should seek advice from a qualified investment adviser.
Full performance can be found on the company or index summary page on the interactive investor website. Simply click on the company's or index name highlighted in the article.