Oil stock chart analysis: Anglo African Oil & Gas
24th September 2018 13:11
by Rajan Dhall from interactive investor
Financial markets analyst Rajan Dhall picks out the day's key industry news and runs the numbers to see what this share price might do next.

The Russian and OPEC delegates met last week to discuss how to increase production levels without distorting prices too dramatically.
After the price crash that reached a low of $26 a barrel (/bbl) in February 2016, the oil cartel agreed on a supply cut deal to stabilise the price. Since then, Russia has joined in, demand levels have risen and OPEC+ needed to figure out how to exit the agreement without the price dropping too fast.
Saudi energy minister Al-Falih on Sunday rejected accusations by US President Donald Trump that OPEC was keeping oil prices elevated, then went on to comment that OPEC has increased production "a good amount" since June.
Last week, Trump tweeted ''We protect the countries of the Middle East, they would not be safe for very long without us, and yet they continue to push for higher and higher oil prices! We will remember".
Today, spot WTI has risen to $72/bbl, the highest level since July 18. Over the next few months, the key themes remain Iranian sanctions and OPEC compliance.
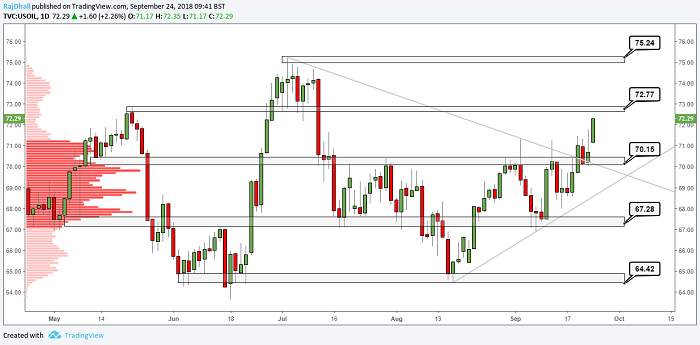
Oil price chart
This daily candlestick chart for spot WTI is pretty bullish, and we have had a strong gap up over the weekend.
Fundamental pressures remain as, since the price broke the trendline, we are yet to retest the break. We are well above the value area of $70/bbl, but we are still making higher highs and higher lows. Watch closely any price action at the two resistance levels on the chart, specifically at $72.77/bbl.
Past performance is not a guide to future performance
Anglo African Oil & Gas
On 5 September, Anglo African Oil & Gas released an RNS that shocked markets and inspired a price fall from 11.7p down to 8.2p before bottoming out at 6.5p a few days later. The company informed its drilling contractor, SMP, that they had experienced a topside issue that has affected the rig and stopped drilling immediately.
Today, Anglo African has said the construction of the extended pad at the Tilapia field in the Republic of the Congo has been completed ahead of schedule. Furthermore, AAOG expects to commence drilling operations on the TLP-103C well in the week commencing 8 October.
Executive chairman David Sefton said: "Following the unwelcome need to pull out of TLP-103 and re-spud, the operations team, the rig contractor and our external consultants have worked tirelessly to get the drilling programme back on track as soon as practicable and to take steps to ensure that there is no repeat of the problem.
"The new drilling pad is now complete and relocation has allowed for an improved deviation of the well to target the apex of the Djeno horizon.'"
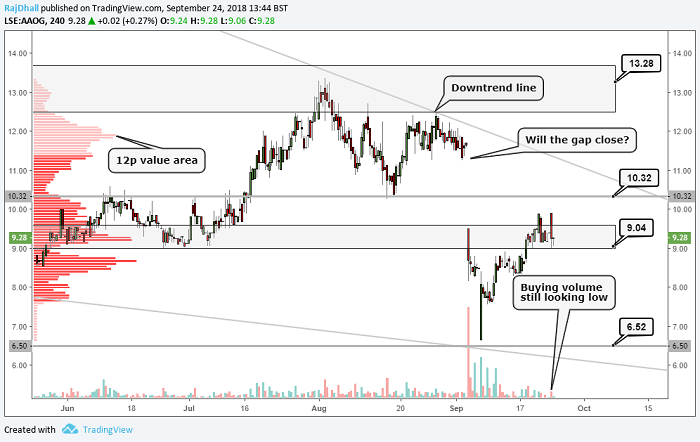
This is a 4-hour chart for Anglo African Oil & Gas. You can see the price gapped up earlier in the session and subsequently has moved lower.
Past performance is not a guide to future performance
Anglo shares have risen sharply since the recent low, but there are a few resistance levels to contend with here, notably the 10.32p previous wave low, and then the downward trendline – currently at around 11.5p.
It's clear to see the price has not broken the bear trend yet, but with the fundamentals looking up, keep an eye out for any pick up in buying volume needed to support a move higher.
The next value area (the price where most shares are traded) is at around the 12p level, which is also where the share price dived from at the beginning of September. If positive news persists and we do see further buying, Anglo could get there and await a fresh catalyst.
It's difficult contemplating prices hitting lows again after today's RNS.
Rajan Dhall is a freelance contributor and not a direct employee of interactive investor.
These articles are provided for information purposes only. Occasionally, an opinion about whether to buy or sell a specific investment may be provided by third parties. The content is not intended to be a personal recommendation to buy or sell any financial instrument or product, or to adopt any investment strategy as it is not provided based on an assessment of your investing knowledge and experience, your financial situation or your investment objectives. The value of your investments, and the income derived from them, may go down as well as up. You may not get back all the money that you invest. The investments referred to in this article may not be suitable for all investors, and if in doubt, an investor should seek advice from a qualified investment adviser.
Full performance can be found on the company or index summary page on the interactive investor website. Simply click on the company's or index name highlighted in the article.