Private Investor Performance Index Q2 2021
Young investors and the wealthy outperform as investment trusts' power returns.
12th July 2021 11:18
by Jemma Jackson from interactive investor
Young investors and the wealthy outperform as investment trusts' power returns.

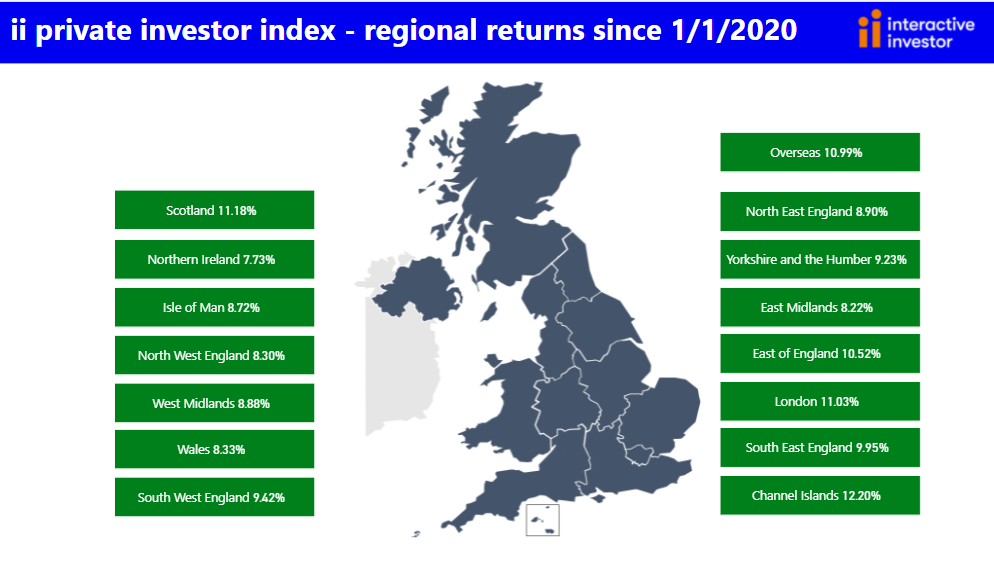
- Scotland outperforms rest of UK in Q2, followed by the North East of England, South-West England and the Channel Islands
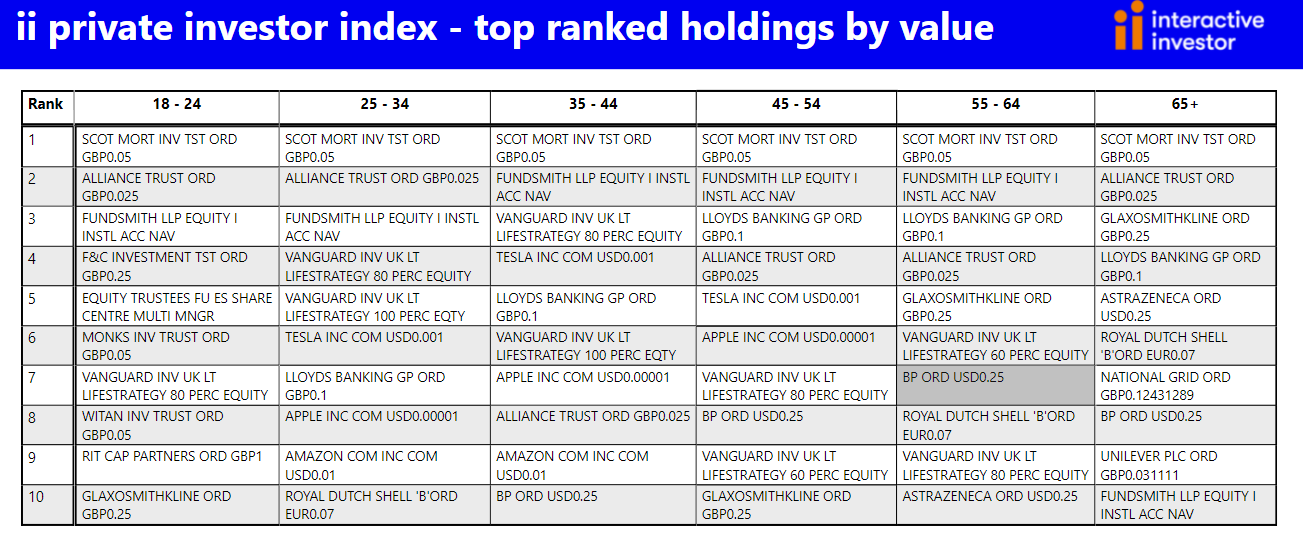
- Scottish Mortgage, Alliance Trust and Fundsmith Equity were among the most held among all age categories, while AstraZeneca, Lloyds and Royal Dutch Shell are among the most widely held by the over-55s.
interactive investor, the UK’s second-largest DIY investment platform, has today published its latest Private Investor Performance Index*.
With interactive investor’s customer performance data now going back 18 months, the index charts the performance highs and lows since the first coronavirus cases emerged in the UK, and breaks down performance into more recent time periods.
During the past year and a half, the average ii customer account is up 9.9% in median average terms, way ahead of the 0.2% for the FTSE All-Share, highlighting the advantages of having a globally diversified portfolio. But it is behind the 26.2% return of the FTSE World Index.
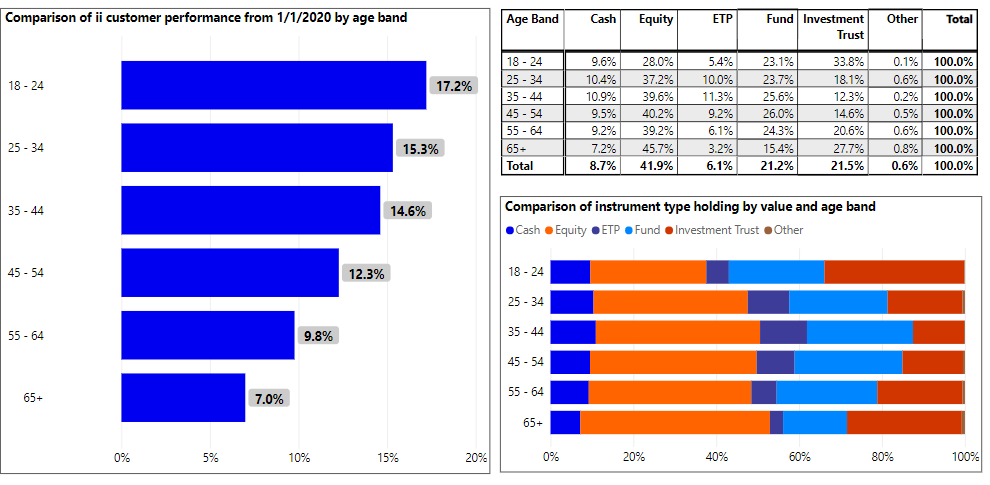
Over 18 months, 12 months and three months to 30 June 2021, the 18- 24 age category has outperformed all other age groups. This group has much greater exposure to investment trusts compared to the average interactive investor customer account (33.8% versus 21.5%). Exposure to investment trusts can boost performance in a rising market but be a drag in a falling market. That’s because many investment trusts can gear (borrow) to enhance returns.
Richard Wilson, CEO, interactive investor, says: “Our Private Investor Performance Index offers a useful barometer of how private investors are faring, whatever the weather. The past 18 months have been challenging emotionally, socially and economically, and although our customers’ investment portfolios fared well, it’s a time we would not want to repeat.
“Successful investing means taking a long-term view, avoiding knee-jerk decisions, and diversifying well, which we have seen many customers doing to navigate the storms. During a period when we have often heard about younger investors ramping up their risk profiles, our data suggests that the cliches might need revising.”
Quarter 2 and beyond
The average ii customer portfolio, in median average terms, grew by 5.4% in Q2 2021. This was a little behind the FTSE All-Share index (up 5.6%) and compared to 7.5 for the FTSE World Index.
In the past six months, the average ii customer portfolio was up 8.7% compared to 11.1% for the FTSE All-Share and 11.9% for the FTSE All World.
Over the past 12 months, the average ii customer is up 23%, ahead of the FTSE All-Share, which was up 21.5% and only slightly behind the FTSE World index (25.5%).
While it is hard to draw too many conclusions over such a short time frame, the youngest (18-24) age cohort performed best on average in Q2, returning 6.2%, followed by the 25-34-year-olds, who returned 5.7%. The 55-64 age category performing worst over the three-month period from 1 April – 30 June, but still returning 5.2% - not far behind the average.
The 18-25-year-olds also performed the best out of all the age groups over one year (up 26%) and 18 months (up 17.2%).
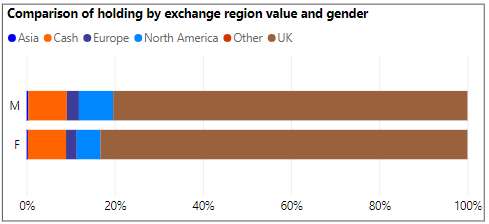
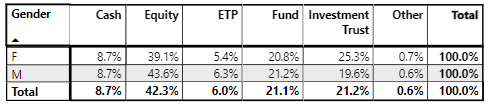
At interactive investor, our customers’ assets are spread across direct equities, funds, investment trusts, ETFs and cash. The largest slice comes from direct equities (42%) and here there is a clear home bias (women have 83% of direct equities in UK stocks, and men 80%).
Wealthy accounts
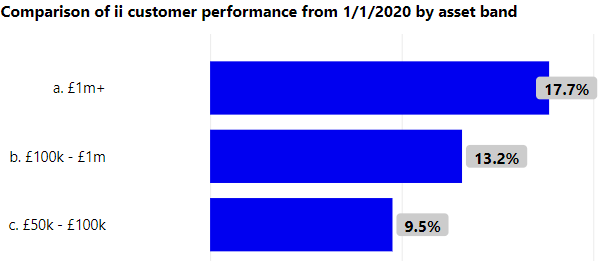
Those with million-pound plus accounts have outperformed all other asset bands over all time periods, up 17.7% over 18 months, 26.5% over 12 months, 8.8% over 6 months and 6.2% in Q2.
Those with £1million plus accounts have the highest investment trust exposure by asset band (25% versus 21.5%) and the lowest cash weighting (5.9% versus an overall average of 8.6%). In a rising market this will help boost portfolios, while acting as a drag in a falling market.
Gender
Women performed slightly better than men in Q2 2021 (5.5% versus 5.2%) – possibly resulting from a higher exposure than men to UK equities – which had a good second quarter.
However, men fared a little better over the 12 months to the end of June (22.1% for women versus 23.5% for men) and over the past 18 months, although it was marginal (9.4% versus 10%). There are far more similarities than differences between accounts, but men have more North American exposure when it comes to shares (8% versus 5% for women).
Moira O’Neill, Head of Personal Finance, interactive investor, comments: “There’s a lot said about male versus female attitudes to risk - and we take it all with a pinch of salt. Our data suggests that women and men invest along very similar lines, and with similar results. There’s some great stories out there of women investing extremely successfully – and we would like to hear more of these.”
Trading Trends
Scottish Mortgage (LSE:SMT), Alliance Trust (LSE:ATST) and Fundsmith Equity were among the favourites among all age categories, while variants of the Vanguard LifeStrategy range featured in the top 10 most-held investments by value across the board – bar those 65+ (on average).
When it comes to stocks (on average), Apple (NASDAQ:AAPL) and Amazon (NASDAQ:AMZN) and Tesla (NASDAQ:TSLA) were popular among the 25-34, 35-44 age cohorts, while for 45-54-year-olds, it was Apple and Tesla. Lloyds Banking Group (LSE:LLOY), Royal Dutch Shell (LSE:RDSB) and AstraZeneca (LSE:AZN) were among the most favoured among those aged 55+.
Regions
interactive investor customers based in Scotland performed best in Q2 2021, up 5.7%, followed by the North East of England (5.5%), then South West England and Channel Islands (each 5.4%).
Over the year to 30 June 2021, those living in the Channel Islands performed strongest, (25.9%), ahead of Scotland (24.2%) and Yorkshire and the Humber (23.9%).
It is a similar story over the past 18 months, with the Channel Islands once again the best performing region (12.2%) followed by Scotland (11.2%) and London (11.0%).
Notes to editors
*ii customer performances quoted are median values to avoid the influence of outlier performance skewing the data.
The performance is calculated using the Time Weighted Rate of Return with returns calculated before each money transaction, then the results compounded over the reporting period. The time-weighted rate of return (TWR) is a measure of the compound rate of growth in a portfolio. It eliminates the distorting effects on growth rates created by inflows and outflows of money.
Then median averages are calculated independently for each group we analysed – so that outlier performances did not skew the results.
Index performance, unless otherwise stated, is ii using Morningstar, total return in GBP, to end June 2021.
Portfolio values under £20,000 were stripped out to keep the sample representative of ii’s core customer base.
These articles are provided for information purposes only. Occasionally, an opinion about whether to buy or sell a specific investment may be provided by third parties. The content is not intended to be a personal recommendation to buy or sell any financial instrument or product, or to adopt any investment strategy as it is not provided based on an assessment of your investing knowledge and experience, your financial situation or your investment objectives. The value of your investments, and the income derived from them, may go down as well as up. You may not get back all the money that you invest. The investments referred to in this article may not be suitable for all investors, and if in doubt, an investor should seek advice from a qualified investment adviser.
Full performance can be found on the company or index summary page on the interactive investor website. Simply click on the company's or index name highlighted in the article.