Prospects for Barclays shares and new targets for Wall Street
16th May 2022 07:49
by Alistair Strang from Trends and Targets
These UK bank shares have moved sideways for a few months, but independent analyst Alistair Strang explains why it may just be a matter of patience. He also runs new numbers for the Dow Jones.
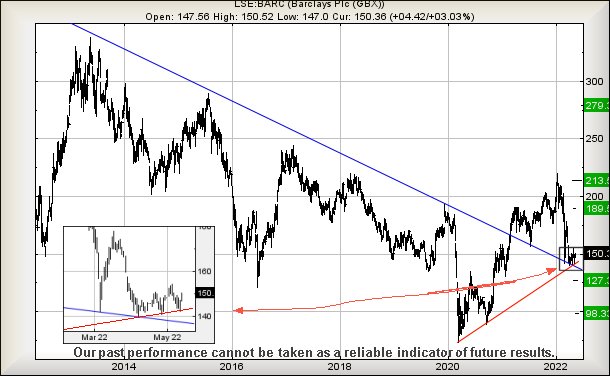
Barclays (LSE:BARC) share price remains behaving, to use a technical term, “utterly uselessly” since April.
The Blue line on the chart below dates back to 2013 and about the only thing we must concede is the share price is paying close attention to it.
In an update to our numbers, now below 140p threatens reversal to an initial target level of 127p. Oddly, we have separate criteria pointing at such a drop ambition, creating a situation where we’d anticipate a solid bounce if such a target level appears.
Our longer term secondary calculates down at 98p but, aside from this sort of price level making an appearance in 2020, very little visually backs up any logic pointing at such a target level. And, in any case, the inset on the chart appears to enforce our thoughts that the market doesn’t want Barclays to drop. It just doesn’t want the share price to go up either!
- Why reading charts can help you become a better investor
- Barclays manages profits beat despite mega fine
- 60 reasons to sell your UK shares
Presently trading around 150p, our inclination is to allocate 169p as a trigger level, our thought process suggesting that should this share price trade above 169p, “proper” recovery should prove difficult to restrain. In this scenario, sharp movement to an initial 189p looks very possible with secondary, if exceeded, calculating at 213p.
Visually, there appears to be a threat of hesitation should this 213p make an appearance as some sort of glass ceiling becomes extremely probable. The chart inset suggests, with Barclays, it’s all just a matter of patience. He’s hoping!
Source: Trends and Targets. Past performance is not a guide to future performance
Wall Street
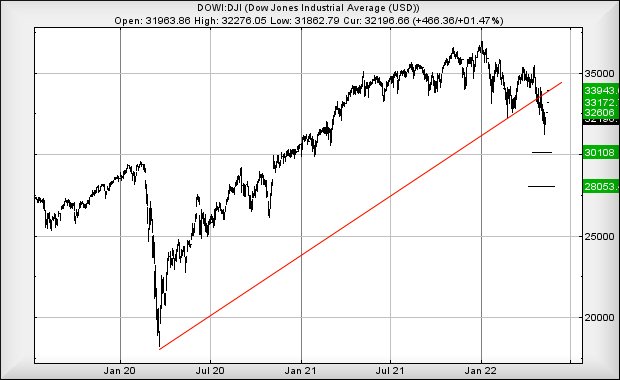
When we previously reviewed Wall Street in March, we’d proposed the threat of reversal to the 31,000 level. At the time the Dow Jones was trading around 33,900, so it was quite a big drop to consider. The US market hit 31,200 last week, making us question whether this shall be deemed “close enough”, creating a situation where we should anticipate a bounce?
It certainly appears to be the case. The bounce just above our Big Picture target level should have faded away by 32,200 points as, theoretically, there was only sufficient force to fuel a 1,000 point rebound. However, the market bounced higher, futures even joining in the fun by reaching 32,300 points. Maybe it is the case, by bouncing just before our drop target and bouncing higher than initial calculations permitted, we should now regard Wall Street as enjoying some hidden strength.
This being the case, now above 32,300 calculates with the potential of ongoing recovery to an initial 32,600 with secondary, if exceeded, working out at 33,170 points.
Source: Trends and Targets. Past performance is not a guide to future performance
Of course, there’s a little problem with this secondary ambition as it fails to trouble the level at which the Red uptrend was broken (33,650 points), calling into question the integrity of any recovery.
Currently, we can calculate a third target level, should 33,170 be exceeded, at 33,900 points but, to be honest, we don’t expect it. Instead, the market “feels” like it risks experiencing a slowdown for a while.
If trouble is planned in the days ahead, the Dow Jones now needs below 31,400 to justify serious concern, as we can point out new drop target levels at an initial 30,100 with secondary 28,000.
Alistair Strang has led high-profile and "top secret" software projects since the late 1970s and won the original John Logie Baird Award for inventors and innovators. After the financial crash, he wanted to know "how it worked" with a view to mimicking existing trading formulas and predicting what was coming next. His results speak for themselves as he continually refines the methodology.
Alistair Strang is a freelance contributor and not a direct employee of Interactive Investor. All correspondence is with Alistair Strang, who for these purposes is deemed a third-party supplier. Buying, selling and investing in shares is not without risk. Market and company movement will affect your performance and you may get back less than you invest. Neither Alistair Strang or Interactive Investor will be responsible for any losses that may be incurred as a result of following a trading idea.
These articles are provided for information purposes only. Occasionally, an opinion about whether to buy or sell a specific investment may be provided by third parties. The content is not intended to be a personal recommendation to buy or sell any financial instrument or product, or to adopt any investment strategy as it is not provided based on an assessment of your investing knowledge and experience, your financial situation or your investment objectives. The value of your investments, and the income derived from them, may go down as well as up. You may not get back all the money that you invest. The investments referred to in this article may not be suitable for all investors, and if in doubt, an investor should seek advice from a qualified investment adviser.
Full performance can be found on the company or index summary page on the interactive investor website. Simply click on the company's or index name highlighted in the article.