Serica Energy: The catalyst for 18% surge
Oil prices are gushing higher and Serica Energy is thriving too. Our markets analyst has the latest.
17th April 2019 13:47
by Rajan Dhall from interactive investor
Oil prices are gushing higher and Serica Energy is thriving too. Our markets analyst has the latest.

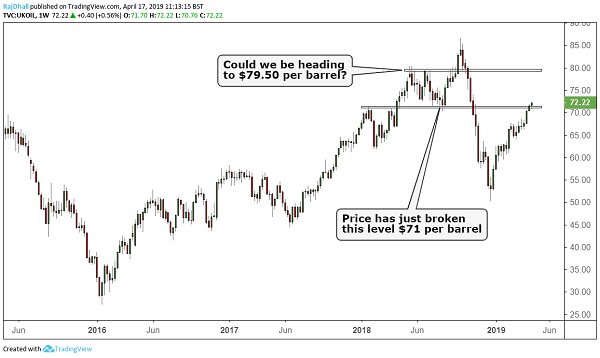
Oil markets have been firmly trending upwards recently as it seems all the bullish stars have aligned.
Most recent data from China shows the mountain of monetary stimulus seems to be having the desired effect, as year-on-year GDP was 10 basis points above expectations and industrial production for March smashed expectations of 5.6% year-on-year to reach 8.5%.
This, coupled with a drawdown in the US API (American Petroleum Institute) supplies data last night, sent the spot price of West Texas Intermediate (WTI) up 0.8% to a high of $64.55 per barrel.
Elsewhere, this week the energy markets are preparing for the latest information from the shale industry as earnings season kicks off.
US crude oil production continues to rise, up from 11.7 to 12.2 million barrels per day in Q1, despite more rigs being offline according to Baker Hughes data.
Brent crude hit its highest level this year, reaching $72.20 per barrel and, if Department of Energy (DoE) data shows a draw today, it will be the first time in four weeks inventories have declined, defying forecasts which predicted an increase.
Source: TradingView Past performance is not a guide to future performance
Serica Energy
Serica Energy (LSE:SQZ) has announced its financial results for the year ended 31 December 2018. In terms of the numbers, gross profit increased by 30.6%, operating profit fell to US$9.1 million versus $14.1 million in 2017, although this was due to a one-off BKR (Bruce, Keith and Rhum fields in the UK North Sea) transition cost of $11.7 million.
Last year, Serica bought operated interests in the BKR fields from BP (LSE:BP.), plus additional interests in the Bruce and Keith fields from Total (EURONEXT:FP), BHP (LSE:BHP) and Marubeni. As a "delighted" chairman Tony Walker said, the deals have bought "very material financial and strategic benefits to the company and its shareholders".
These results only include one month of production from BKR and less than three months from Erskine. Remember too that Serica gets 50% of cash-flow from the BKR fields in 2019, rising to 60% in 2020 and 100% after that.
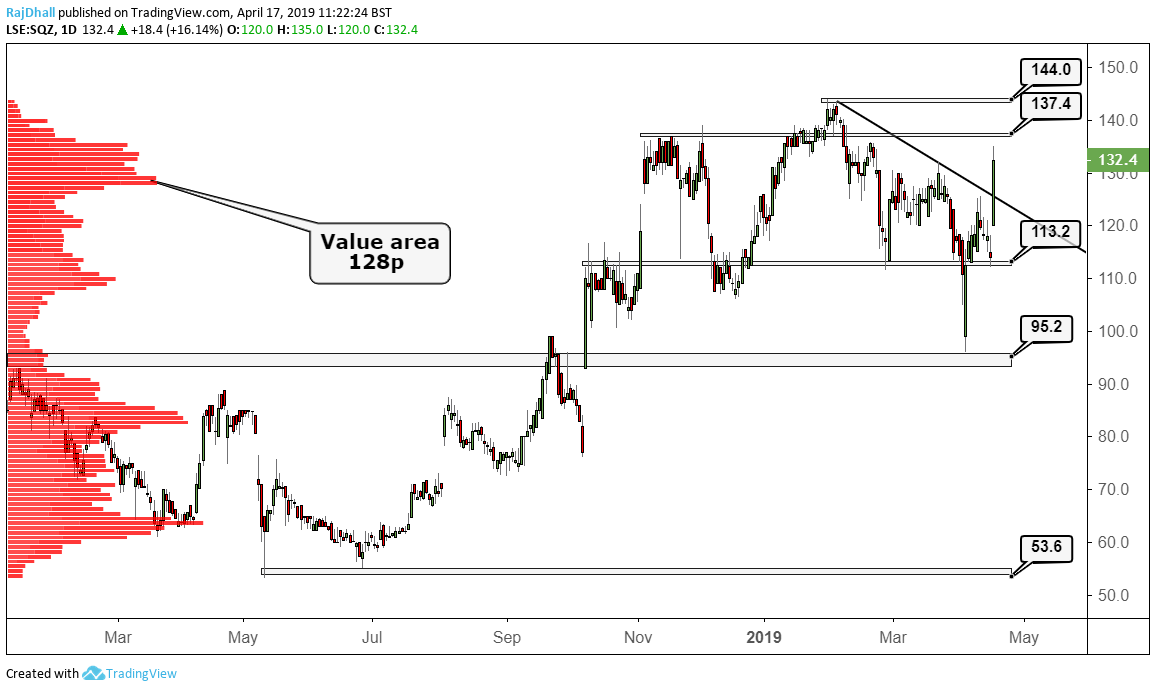
It's all great news following the recent abandonment of the Rowallan well in the UK central North Sea. On that news, published 4 April, the share price hit a low of 96p but, after today's results, the price has recovered to reach 135p a 40% recovery and a two-month high.
In terms of the future outlook, the company noted that net production from the Bruce, Keith, Rhum and Erskine fields has totalled over 30,000 barrels per day in Q1 2019. Work on improving uptime at the Bruce platform will also help increase average production rates from the BKR fields.
The company is also looking to expand the BKR assets, which is great news for shareholders, and they already have Erskine restarted in October which produced an average of 3,100 barrels of oil equivalent per day (boepd) till the end of March.
In addition to this, the company aims to get its "first gas" produced at the Columbus gas field by 2021.
Source: TradingView Past performance is not a guide to future performance
Looking at the chart above, it seems Serica's share price could test the highs of 144p if the good run of news continues. Right now, the 137p resistance level stands in the way, which was a formidable level back in November 2018.
There is certainly a value area represented by the bell curve on the left-hand side of the chart. The 128p area is where most contracts changed hands and could act as support moving forward.
Failing that, the 113p support level seems far off, but would be the next level down. All in all, the company has been in a firm uptrend since July last year and, after a brief consolidation, it is conceivable that the share price manages a new high.
These articles are provided for information purposes only. Occasionally, an opinion about whether to buy or sell a specific investment may be provided by third parties. The content is not intended to be a personal recommendation to buy or sell any financial instrument or product, or to adopt any investment strategy as it is not provided based on an assessment of your investing knowledge and experience, your financial situation or your investment objectives. The value of your investments, and the income derived from them, may go down as well as up. You may not get back all the money that you invest. The investments referred to in this article may not be suitable for all investors, and if in doubt, an investor should seek advice from a qualified investment adviser.
Full performance can be found on the company or index summary page on the interactive investor website. Simply click on the company's or index name highlighted in the article.