SSE shares sparking into life again?
Despite some unexpected behaviour from this energy company's share price, independent analyst Alistair Strang believes movement actually makes a degree of sense.
31st July 2025 07:29
by Alistair Strang from Trends and Targets

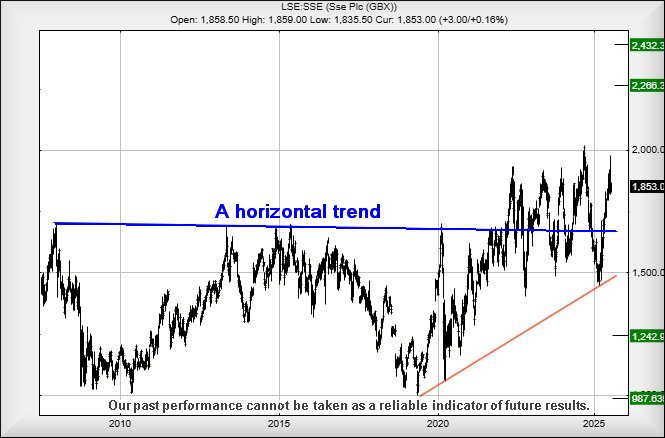
One of our favourite trend lines is the “horizontal trend”. Essentially, if you want a “safe” trade, taking a long position at the point where a price exceeds the horizontal trend and snatching a quick 10-15% price rise rarely goes wrong. Making this scenario a little more solid, in March 2024 we’d also given criteria for movement at SSE (LSE:SSE) to 1,935p, an ambition achieved in September last year. But something quite strange has been happening!
- Invest with ii:Open a Stocks & Shares ISA | Top ISA Funds | Transfer your ISA to ii
When we look at how the share price has behaved since it bettered our horizontal trend, things have been slightly mad, the value bouncing above and below the flat Blue trend line around 1,670p, behaviour which has probably being driving technical analysts utterly insane.
To be honest, the share has totally fouled up any calculations above our prior target of 1,935p. We’ve a growing suspicion this prior target level shall be again assigned with the power to create yet another horizontal trend. Should this be the case, future share price closure above 1,935p should prove significant, a movement capable of triggering some interest in a future 2,266p with our secondary, if beaten, a longer term 2,432p.
This begins to feel a little silly, creating an assumption that a horizontal trend shall simply move upward rather than a share price exhibiting conventional behaviour and entering a proper climbing (or failing) cycle. But for a sector such as this, where movements traditionally prove quite stale, it actually makes a degree of sense, though will take getting used to.
Should things intend to go wrong for SSE, it needs below 1,487p to cause trouble, giving the threat of reversal to an initial 1,242p with our secondary, if broken, a visually sane bottom at 987p. Obviously, nothing is currently suggesting such a thing.
Source: Trends and Targets. Past performance is not a guide to future performance.
Alistair Strang has led high-profile and "top secret" software projects since the late 1970s and won the original John Logie Baird Award for inventors and innovators. After the financial crash, he wanted to know "how it worked" with a view to mimicking existing trading formulas and predicting what was coming next. His results speak for themselves as he continually refines the methodology.
Alistair Strang is a freelance contributor and not a direct employee of Interactive Investor. All correspondence is with Alistair Strang, who for these purposes is deemed a third-party supplier. Buying, selling and investing in shares is not without risk. Market and company movement will affect your performance and you may get back less than you invest. Neither Alistair Strang or Interactive Investor will be responsible for any losses that may be incurred as a result of following a trading idea.
These articles are provided for information purposes only. Occasionally, an opinion about whether to buy or sell a specific investment may be provided by third parties. The content is not intended to be a personal recommendation to buy or sell any financial instrument or product, or to adopt any investment strategy as it is not provided based on an assessment of your investing knowledge and experience, your financial situation or your investment objectives. The value of your investments, and the income derived from them, may go down as well as up. You may not get back all the money that you invest. The investments referred to in this article may not be suitable for all investors, and if in doubt, an investor should seek advice from a qualified investment adviser.
Full performance can be found on the company or index summary page on the interactive investor website. Simply click on the company's or index name highlighted in the article.