Stockwatch: should you have these two UK banks in your ISA?
Bank stocks have come a long way in the past few months, but after leading the FTSE 100 rally to record highs, analyst Edmond Jackson asks whether it’s time to double down or take profit?
26th April 2024 11:57
by Edmond Jackson from interactive investor

In February 2023, I examined the case for UK bank shares offering long-term value – given attractive risk/reward profiles, especially versus similar in the US.
I suggested their long and short-term charts were very similar, chiefly because bank shares are affected by trends in interest rates and the wider economy. A decade or more of zero interest rate policy by central banks had compromised lenders’ business models, hence poor shareholder returns. The return of inflation then saw the US Federal Reserve raise its inter-bank lending rate to around 5%, establishing a tailwind.
- Invest with ii: Open a Stocks & Shares ISA | ISA Investment Ideas | Transfer a Stocks & Shares ISA
Barclays is off the naughty step
Barclays (LSE:BARC) was my initial pick at 173p, as a “buy” to average into – given a sharp 60% discount to net tangible assets and, according to consensus forecasts, a circa 5x price/earnings (PE) ratio and dividend yield above 5%. Various past controversies also meant a “bad boy” reputation among investors, hence a true “contrarian” share.
While presently affirmed by way of a circa 200p share price, my call was premature in the sense that the share price fell last year into a 140-165p range until only last February. A sharp rally then ensued, extending to a near 7% rise yesterday despite lacklustre first-quarter 2024 results. The basis for comparison for most banks, a year or so ago, was however especially strong. Barclays’ gain even accelerated yesterday afternoon despite US shares plunging. Sentiment has therefore definitely changed, at least for now. Barclays is up around 45% since February, yet the 12-month forward dividend yield looks a useful 4.5%.
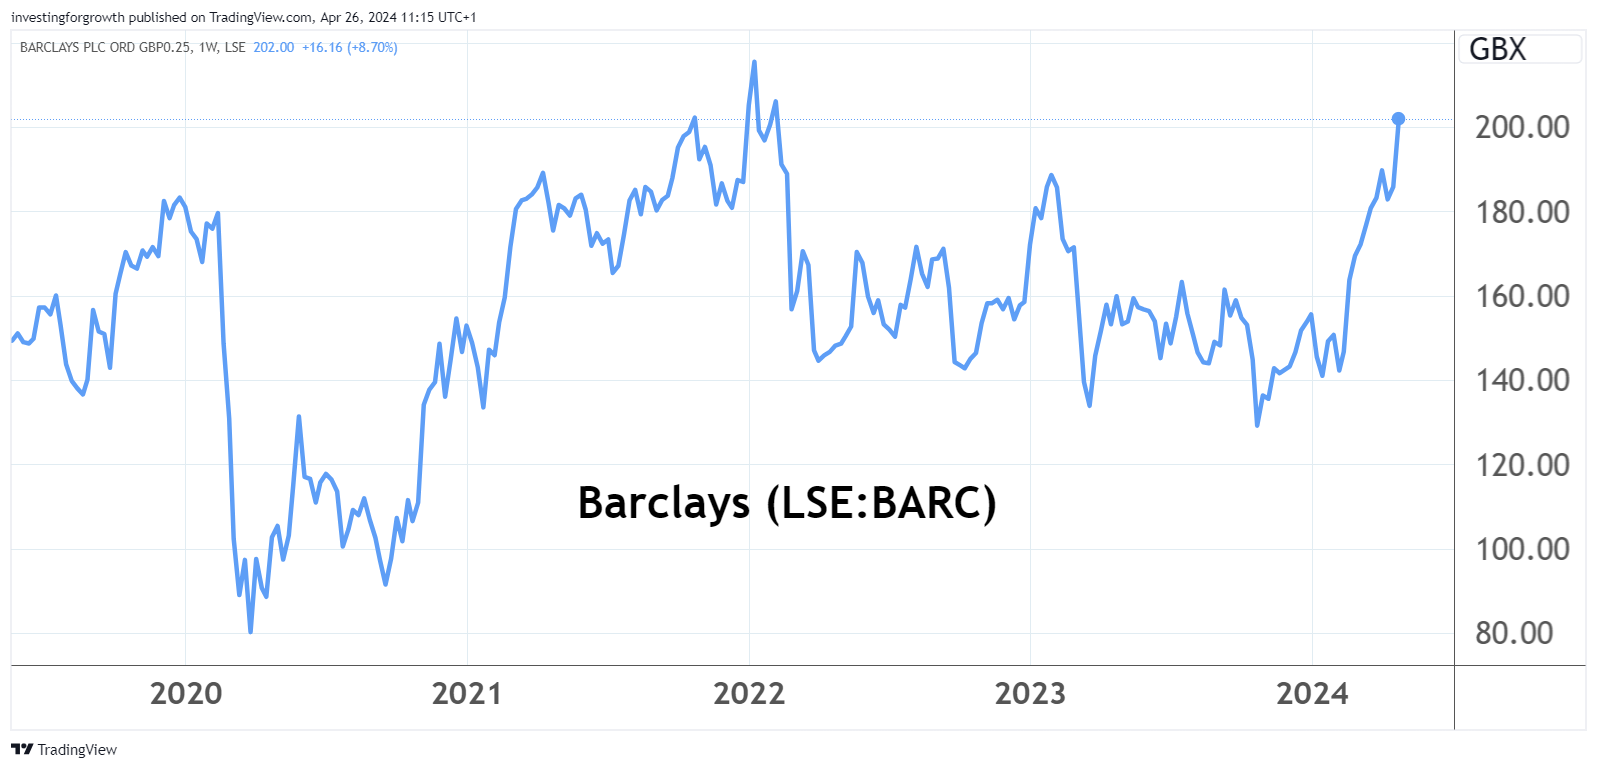
Source: TradingView. Past performance is not a guide to future performance.
First-quarter 2024 numbers showed a like-for-like 12% slip in pre-tax profit to £2.3 billion and return on net tangible assets (or equity) of 12.3% versus 15.0% like-for-like; albeit against strong comparators as banks recovered a year ago from Covid disrupting the economy.
An overall 10% return on equity is targeted for 2024 and 12% for 2026 which would set record levels (see table).
Barclays - financial summary
Year end 31 Dec
| 2018 | 2019 | 2020 | 2021 | 2022 | 2023 | |
| Turnover (£ million) | 23,289 | 24,024 | 24,144 | 24,493 | 28,465 | 29,106 |
| Operating margin (%) | 15.0 | 18.1 | 12.7 | 33.5 | 24.6 | 22.5 |
| Operating profit (£m) | 3,494 | 4,357 | 3,065 | 8,194 | 7,012 | 6,557 |
| Net profit (£m) | 2,349 | 3,274 | 2,383 | 7,009 | 5,928 | 5,259 |
| EPS - reported (p) | 9.2 | 14.1 | 8.6 | 35.6 | 29.8 | 26.9 |
| EPS - normalised (p) | 19.2 | 22.9 | 25.5 | 42.6 | 38.8 | 31.2 |
| Return on total capital (%) | 0.3 | 0.4 | 0.2 | 0.6 | 0.5 | 0.4 |
| Operating cashflow/share (p) | 52.9 | -2.9 | 325 | 281 | 179 | -5.8 |
| Capital expenditure/share (p) | 8.1 | 10.3 | 7.5 | 9.9 | 10.4 | 10.8 |
| Free cashflow/share (p) | 44.8 | -13.2 | 318 | 271 | 169 | -16.6 |
| Dividend/share (p) | 0.0 | 3.0 | 1.0 | 6.0 | 7.3 | 8.0 |
| Covered by earnings x | 0.0 | 4.7 | 8.6 | 5.9 | 4.1 | 3.4 |
| Cash (£m) | 187,644 | 159,882 | 200,027 | 248,272 | 266,366 | 234,093 |
| Net debt (£m) | 1,323 | 18,064 | -6,849 | -27,606 | -16,867 | 9,882 |
| Net assets (£m) | 62,556 | 64,429 | 65,797 | 69,052 | 68,292 | 71,204 |
| Net assets per share (p) | 365 | 272 | 379 | 412 | 430 | 470 |
Source: company accounts.
UK income has been hurt by “adverse dynamics” in deposits and mortgages, and investment income by lower fixed income returns. On the investment banking side, greater fees for debt and equity issuance were more than offset by lower fees in advisory and transaction banking. The stand-out performer was the wealth management side, up 20% albeit representing only 4.5% of group income.
Meanwhile, and despite efficiency savings helping a 3% reduction in operating costs, total operating expenses edged up 2%. Credit impairment charges were flat at £0.5 billion.
While “at least” £10 billion of capital is planned returned to shareholders between 2024 and 2026, through dividends and buybacks, the extent of dividend payment will be kept constant. Dividend growth would be achieved by reducing shares issued. But at least this underpins a sense of dividend growth for an already meaningful yield.
Net tangible assets per share has evolved respectably from 301p a year ago to 335p at end-March, hence a circa 40% discount – you could continue to regard this as a margin of safety, even if it does not mean the shares deserve to rise by two-thirds.
NatWest affirmed as sector leader
While there seem to be reservations about Lloyds Banking Group (LSE:LLOY), NatWest Group (LSE:NWG) is off to the races even more definitively. Last June’s fiasco over Nigel Farage and the NatWest-owned Coutts possibly aided a downtrend to 176p in November, but around 303p after today’s first-quarter numbers it is up 72% from that low – or by 47% on 204p as February’s benchmark.
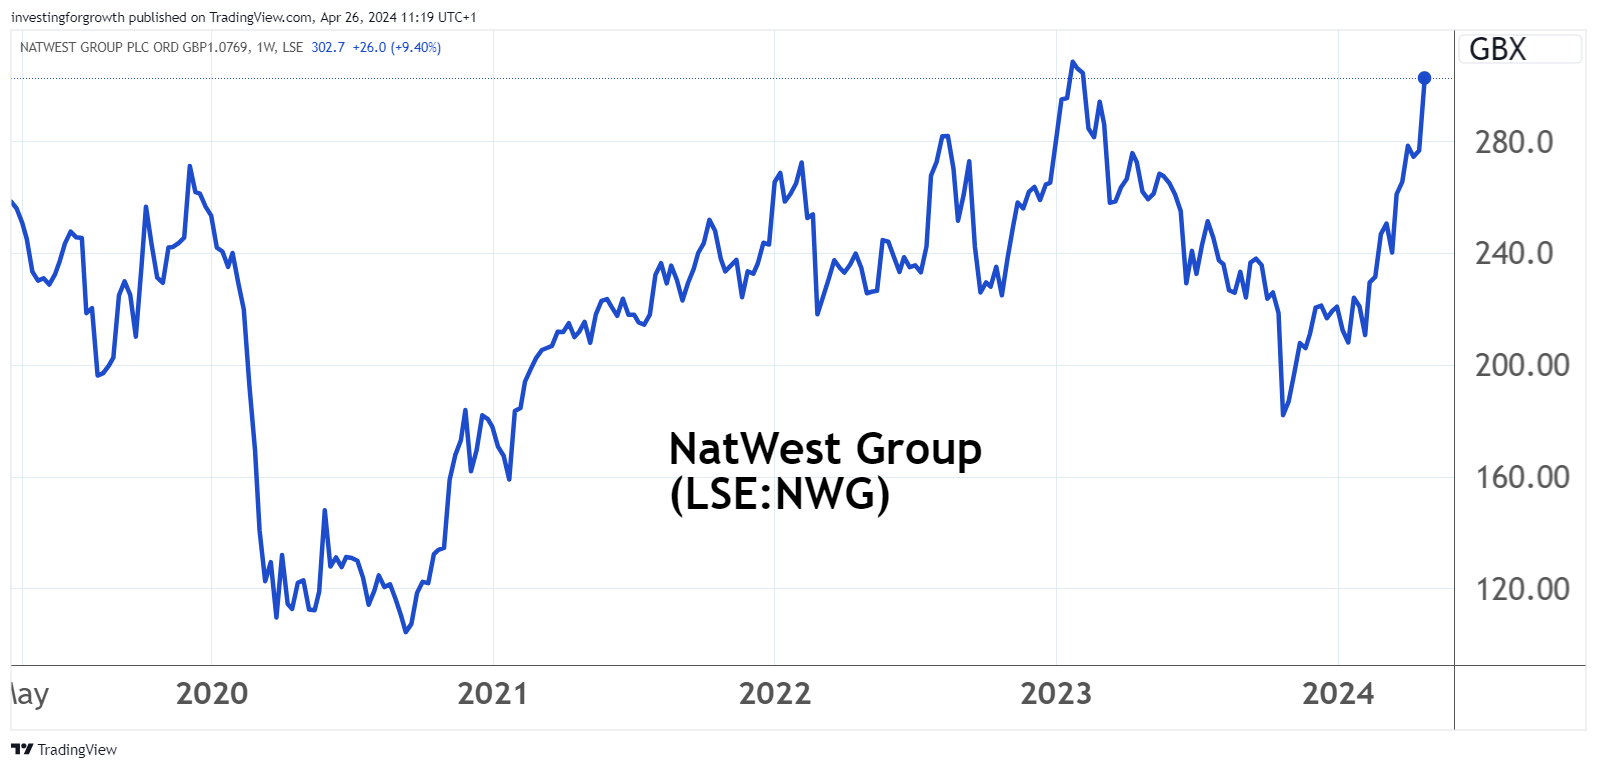
Source: TradingView. Past performance is not a guide to future performance.
Yet NatWest’s 12-month forward yield looks to be 5.7% with a remarkable four times cover based on consensus forecasts. As Richard Hunter’s article explains, today’s cheer is largely about the bank beating expectations, which affirms NatWest as leader of the UK clearing bank pack. In which case, the attractive yield ought to have a tad more security given the bank is effectively ahead of consensus.
- NatWest results show why it’s the City’s favourite bank
- Sign up to our free newsletter for investment ideas, latest news and award-winning analysis
I would add that this makes the shares a choice pick to play what still looks predominantly a macro trend.
NatWest Group - financial summary
Year end 31 Dec
| 2018 | 2019 | 2020 | 2021 | 2022 | 2023 | |
| Turnover (£ million) | 14,426 | 14,888 | 11,690 | 11,325 | 14,223 | 15,649 |
| Operating margin (%) | 23.3 | 26.8 | -4.1 | 35.6 | 36.1 | 39.5 |
| Operating profit (£m) | 3,359 | 3,983 | -481 | 4,032 | 5,132 | 6,178 |
| Net profit (£m) | 2,159 | 3,539 | -372 | 3,268 | 3,589 | 4,636 |
| EPS - reported (p) | 14.5 | 25.6 | -7.8 | 24.7 | 36.3 | 48.9 |
| EPS - normalised (p) | 27.9 | 25.6 | 1.8 | 35.6 | 42.8 | 52.0 |
| Return on total capital (%) | 0.5 | 0.6 | -0.1 | 0.5 | 0.7 | 0.9 |
| Operating cashflow/share (p) | -60.3 | -27.4 | 259 | 496 | -439 | -189 |
| Capital expenditure/share (p) | 5.5 | 5.0 | 3.4 | 8.3 | 6.4 | 8.8 |
| Free cashflow/share (p) | -65.8 | -32.4 | 256 | 487 | -446 | -198.0 |
| Dividend/share (p) | 5.9 | 2.2 | 3.2 | 11.3 | 13.8 | 17.0 |
| Covered by earnings x | 2.5 | 11.9 | -2.4 | 2.2 | 2.6 | 2.9 |
| Cash (£m) | 101,844 | 88,547 | 131,444 | 185,439 | 151,971 | 111,176 |
| Net debt (£m) | -5,054 | 19,631 | -31,096 | -88,908 | -54,319 | 8,300 |
| Net assets (£m) | 45,736 | 43,547 | 43,860 | 41,796 | 36,488 | 37,157 |
| Net assets per share (p) | 409 | 388 | 389 | 354 | 339 | 376 |
Source: company accounts.
Something has definitely twitched in the last two months
I say that what drives these re-ratings is belief in a proverbial “Goldilocks” scenario – implying inflation brought under control without higher interest rates causing serious recession. Obviously, in the US yesterday, alarm bells sounded about “stagflation” as growth falters and inflation remains stubborn to get down to central bankers’ 2% target.
Here, consumer price inflation is a similar situation – down from 4.2% in February to 3.8% in March – yet the Bank of England is guiding that interest rates will need to remain elevated. Most likely, its monetary policy committee senses that if UK rates are cut before the US moves, it could bring on a self-defeating slide in sterling which fuels input cost inflation.
- Trading Strategies: buying opportunities for long-term investors
- Positive start to 2024 for UK dividends, but there’s a sting in the tail
Both in the US and UK, relatively affluent consumers are benefiting from asset price inflation – confidently gadding about on planes and in restaurants, spending on home improvement and the like. Yet some manufacturers for example, say they are yet to see improvement.
Today, a latest red flag alert from Begbies Traynor Group (LSE:BEG) cites a 31% hike in “significant financial distress” over the first quarter of 2023, with each of the 22 sectors covered up double digits. But while “critical” financial distress is up 20% on Q1 2023, it is down over 15% on Q4 2023.
That latter aspect helps explain why the current rally in bank shares can seem perverse, given a likelihood of bad debts as interest rates remain high. The jump re-iterates how stock market prices turn up at a low point in the business cycle before real evidence is in. Banks are perhaps the leading indicator, likewise on fears of recession.
Moreover, those such as Barclays and NatWest still trade on low PE multiples and high yields, relative to the US where, for example, JPMorgan Chase & Co (NYSE:JPM) at 193p trades on a PE around 12x and yield just over 2%.
As yet, bank business models benefit from higher interest rates while current/deposit accounts still offer next-to-nothing, and no real recession staves off balance sheet write-downs. With stock markets returning to all-time highs, investment banking is doing well – or should be – given this helps capital-raising and securities trading.
Barclays and NatWest rate at least a ‘strong hold’
A downside case would constitute investors having got carried away amid recent enthusiasm for “Goldilocks”; a reality check lies ahead involving an aspect of stagflation.
Furthermore, what if Russia prevails in Ukraine this summer, dashing Nato’s credibility? Middle East conflict festers and something kicks off in the South China Sea or Taiwan, when the West is already stretched militarily and by way of debts. Such would be the doomster scenario whereby bank shares could bear the brunt.
I would therefore be cautious about chasing this rally with fresh capital but stay attuned to economic numbers. In a long-term and international context, I would “hold” major banks rather than take profits. Their strength is logical to anticipate economic recovery, it’s just unclear quite when it will happen.
Edmond Jackson is a freelance contributor and not a direct employee of interactive investor.
These articles are provided for information purposes only. Occasionally, an opinion about whether to buy or sell a specific investment may be provided by third parties. The content is not intended to be a personal recommendation to buy or sell any financial instrument or product, or to adopt any investment strategy as it is not provided based on an assessment of your investing knowledge and experience, your financial situation or your investment objectives. The value of your investments, and the income derived from them, may go down as well as up. You may not get back all the money that you invest. The investments referred to in this article may not be suitable for all investors, and if in doubt, an investor should seek advice from a qualified investment adviser.
Full performance can be found on the company or index summary page on the interactive investor website. Simply click on the company's or index name highlighted in the article.
Disclosure
We use a combination of fundamental and technical analysis in forming our view as to the valuation and prospects of an investment. Where relevant we have set out those particular matters we think are important in the above article, but further detail can be found here.
Please note that our article on this investment should not be considered to be a regular publication.
Details of all recommendations issued by ii during the previous 12-month period can be found here.
ii adheres to a strict code of conduct. Contributors may hold shares or have other interests in companies included in these portfolios, which could create a conflict of interests. Contributors intending to write about any financial instruments in which they have an interest are required to disclose such interest to ii and in the article itself. ii will at all times consider whether such interest impairs the objectivity of the recommendation.
In addition, individuals involved in the production of investment articles are subject to a personal account dealing restriction, which prevents them from placing a transaction in the specified instrument(s) for a period before and for five working days after such publication. This is to avoid personal interests conflicting with the interests of the recipients of those investment articles.
Important information: Please remember, investment values can go up or down and you could get back less than you invest. If you’re in any doubt about the suitability of a Stocks & Shares ISA, you should seek independent financial advice. The tax treatment of this product depends on your individual circumstances and may change in future. If you are uncertain about the tax treatment of the product you should contact HMRC or seek independent tax advice.