Stockwatch: Two small-cap takeover candidates
Opportunities have emerged for predators to buy good companies on the cheap, writes companies analyst.
12th March 2019 10:57
by Edmond Jackson from interactive investor
As global economic pressures tighten, opportunities emerge for predators to buy good companies on the cheap, writes companies analyst Edmond Jackson.

Do profit warnings from international firms imply the challenge to offset Brexit risks – for Europe as well as Britain – is getting trickier?
Equities have rebounded from their plunge during the second half of 2018, mainly in the hope central banks will change tack to net stimulus once again. Yet, after a sentiment surge, investors still have to grapple with mixed signals emerging.
Smaller companies - say sub-£200 million in size yet still with global reach - can be more sensitive to change in the macro trend and more exposed to setbacks. I'm thinking both in terms of what this could inform us about the global economy, and value/takeover potential when stocks with strong industry positions get hit.
Xaar price drops below net tangible asset value
This week has started with Xaar (LSE:XAR), warning of a £7 million hit to 2018 annual profit due to delays selling its inkjet printing technology in China. This is in context of consensus for £11.3 million normalised pre-tax profit, a 17% fall anyway on Company REFS' estimation of 2017 normalised profit, with £19 million projected for 2019.
Mind the table (if correct) is showing negative earnings per share (EPS) forecast, and I'd play safe to reckon we're looking at a losses scenario getting worse.
More positively this company had nearly £28 million net cash at the end of 2018, in context of a current market value of £98 million with its stock currently at 126p. See from the table how net tangible assets have been pretty stable around the 140p a share mark, which begs the question of takeover potential – as a £7 million current hit is in context of £142 million net assets, as of June 2018.
Xaar's share price has fallen a long way from 564p in 2015, partly as a result of orienting towards ceramic tiles printed with its products, where demand from the Chinese construction industry initially boomed then slumped.
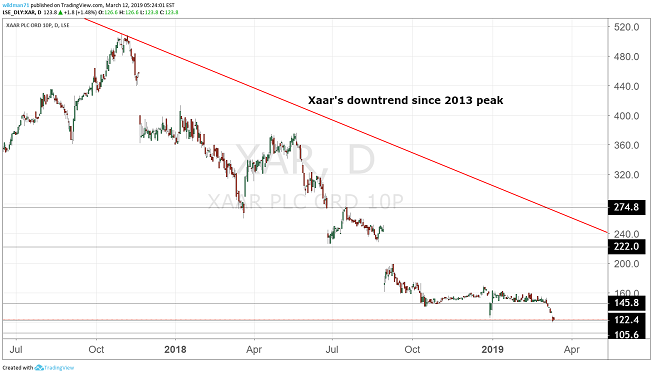
Source: TradingView (*) Past performance is not a guide to future performance
Yet management presents its current set-back as short-term, linked to delays in producing new product – hence a higher inventory and debtors provision. "Integration issues are now behind us, sell-through is expected to increase," it says.
New products have been initiated and recent month's newsflow has shown three companies adopting Xaar technology for packaging and industrial printing, besides ceramics.
While the group's operating margin has declined from about 30% to below 20% in recent years, in normalised terms it could still be attractive. Admittedly, this was 12 years ago, but Xaar fended off a 200p to 220p per share approach from US industrial conglomerate Danaher.
This time around, shareholders could be less supportive of management. The list includes AXA, Schroders, M&G and others well-known, which suggests they believe in Xaar's capability - if only that someone can unlock it.
| Xaar Group - financial summary | Estimates | ||||||
|---|---|---|---|---|---|---|---|
| year ended 31 Dec | 2013 | 2014 | 2015 | 2016 | 2017 | 2018 | 2019 |
| Turnover (£ million) | 137 | 109 | 93.5 | 96.2 | 100 | ||
| IFRS3 pre-tax profit (£m) | 40.1 | 23.1 | 13.6 | 17.9 | 12.3 | ||
| Normalised pre-tax profit (£m) | 40.6 | 24.1 | 19.7 | 19.2 | 13.6 | 11.3 | 19.0 |
| Operating margin (%) | 29.3 | 21.7 | 20.6 | 19.5 | 13.2 | ||
| IFRS3 earnings/share (p) | 41.6 | 24.4 | 16.1 | 18.9 | 18.9 | ||
| Normalised earnings/share (p) | 42.2 | 25.7 | 24.0 | 20.6 | 16.9 | -3.7 | -5.3 |
| Earnings/share growth (%) | 115.0 | -39.1 | -6.8 | -13.9 | -17.9 | ||
| Annual average historic P/E (x) | 17.1 | 19.5 | 19.3 | 16.6 | |||
| Cash flow/share (p) | 61.5 | 25.1 | 53.4 | 18.3 | 16.0 | ||
| Capex/share (p) | 23.0 | 26.8 | 16.2 | 27.7 | 7.2 | ||
| Dividends per share (p) | 5.5 | 8.5 | 9.2 | 9.6 | 10.1 | 2.8 | 2.8 |
| Covered by earnings (x) | 8.0 | 3.1 | 2.7 | 2.2 | 1.5 | -1.4 | -1.9 |
| Yield (%) | 8.0 | 2.2 | 2.2 | ||||
| Net tangible assets per share (p) | 140 | 145 | 145 | 138 | 140 |
Source: Company REFS Past performance is not a guide to future performance
Brexit uncertainties: a boon for small-cap takeovers
I make no apology for repeating this where stocks have de-rated yet the companies involved enjoy strong market positions and are of useful size, possibly introducing new markets for acquirers.
Brexit is contributing to weak sterling and profit warnings, while London is a very open stock market for corporate control. Moreover, Britain is notorious for its technology companies being snapped up by foreigners.
Cambridge-based Xaar is a good example, deriving about 45% of its revenue from EMEA (Europe, the Middle East and Africa), 20% from China likewise the US, and 15% from Japan. Speculative Buy.
Driver also hurt by non-fatal warning
Driver Group (LSE:DRV) is an AIM-listed provider of commercial and dispute resolution services to the construction industry. From a macro perspective, construction is a notable cyclical, sometimes leading the wider economy yet can be fickle.
Recent data for the UK has implied a fairly strong start to 2019, and Driver's UK business likewise appears robust, however it warns of "slowing speed of client conversion, in particular in the Middle East and South East Asian markets as a consequence of local market conditions." Since last December's prelims then, challenges have spread from specifically the United Arab Emirates (Qatar/Kuwait otherwise doing well) to Asia Pacific.
So, underlying profit for its financial year to 30 September 2019 is guided a tad below the 2017/18 result of £3.5 million. In a stock downtrend from 86p mid-2018 and going sideways in the New Year, the price has dropped in the last week from about 70p, finding support at 45p.
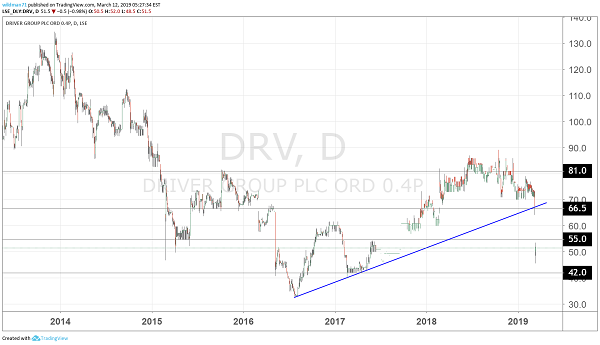
Source: TradingView (*) Past performance is not a guide to future performance
At 50p currently, Driver I capitalised at just £27 million – less than half annual sales, where the operating margin has ranged down from 8% to 5.6%.
As if affirming my regular point about how dealing by directors' wives can be more pertinent, on 18 February the wife of Driver's UK managing director sold 25,000 shares at 73.1p, but the trade was not announced until 1 March.
The official statement does not cite any residual shareholding either. Last Friday's market trading included 431,834 shares denoted as a "sale" at 65p, and various smaller-scale "sales" – that's frustrating to holders relying on published information, albeit a reality check for small-cap investing.
Last December's prelims had cited "a positive start to the new financial year in line with management expectations" and, despite mixed performance in the Middle East – UAE revenues down 9% albeit the smaller Qatar/Kuwait elements up over 30% overall – I concluded the stock a 'buy' at 77p, despite making clear this lacked conviction as to value.
It appeared still possible to respect a 'buy' case after a turnaround plan since mid-2016 involving new top managers and non-executive directors had streamlined and recapitalised the group.
Moreover, generating two-thirds of its revenues from abroad looked useful as Brexit weighed on sterling. The 2018 revenue profile showed Asia-Pacific up 32%, Europe and the Americas up 10%; thus, with turnaround initiatives underway in the UAE, I suggested that if those issues could be resolved then "Driver stands a decent chance of being perceived as a growth company".
I did note there were "no details of the UAE shortfall and while it's an area generally offering opportunities for British business I do come across examples of people hitting trouble here. Let's see what evolves."
| Driver Group - financial summary | ||||||
|---|---|---|---|---|---|---|
| year ended 30 Sep | 2013 | 2014 | 2015 | 2016 | 2017 | 2018 |
| Turnover (£ million) | 36.6 | 39.1 | 48.0 | 52.4 | 60.2 | 62.6 |
| IFRS3 pre-tax profit (£m) | 2.9 | 3.1 | -1.9 | -3.5 | 1.2 | 2.7 |
| Normalised pre-tax profit (£m) | 2.9 | 3.1 | 0.3 | -0.1 | 2.5 | 3.8 |
| Operating margin (%) | 8.1 | 8.0 | 0.8 | 0.2 | 2.5 | 4.6 |
| IFRS3 earnings/share (p) | 8.4 | 8.9 | -6.5 | -11.0 | 2.8 | 3.8 |
| Normalised earnings/share (p) | 8.4 | 8.9 | 0.2 | -0.7 | 5.4 | 6.1 |
| Earnings/share growth (%) | 78.0 | 6.0 | -97.3 | 13.0 | ||
| Price/earnings multiple (x) | 8.9 | |||||
| Annual average historic P/E (x) | 12.4 | 83.3 | 237 | 8.4 | 13.0 | |
| Cash flow/share (p) | 8.6 | -0.9 | -4.5 | -18.3 | 4.4 | |
| Capex/share (p) | 1.2 | 2.2 | 1.6 | 2.3 | 0.6 | |
| Dividends per share (p) | 1.2 | 1.6 | 1.7 | 1.1 | 0.0 | 0.5 |
| Covered by earnings (x) | 8.1 | 6.2 | 0.4 | 12.2 | ||
| Yield (%) | 0.9 | |||||
| Net tangible assets per share (p) | 24.3 | 30.9 | 20.5 | 11.1 | 24.4 | 30.6 |
Company REFS Past performance is not a guide to future performance
So, in hindsight, and with a few menacing clouds over the global economy, my 'buy' conclusion was premature. Yet this latest update also cites Driver's "new business enquiry pipeline at a historically high level, some 20% higher than this time last year...good quality enquiries are coming into the business across all sectors and regions."
This is a leading global company in its sector and continues to strengthen its positions after a turnaround. These are qualities that can attract takeover approaches when stocks are down. Even for a 'people business', the stock is down near net tangible assets of around 30p per share.
Mind, there is not yet any sign of insiders buying now the bad news is out and, while a said "progressive" dividend policy is supported by £5.1 million cash, guidance is for only a modest 0.5p per share this April which amounts to a sub-1% yield.
While just one small company, Driver encapsulates the chief dilemma for equity investors: is the global economy experiencing a temporary wobble, with renewed stimulus programmes in Europe and China underpinning a recovery and "hold/buy stocks now" strategy. Or, is this the early stage of more serious slippage?
If the latter applies then hold off buying, but on a stock-specific view respecting intrinsic value, Driver rates as Add.
*Horizontal lines on charts represent levels of previous technical support and resistance.
Edmond Jackson is a freelance contributor and not a direct employee of interactive investor.
These articles are provided for information purposes only. Occasionally, an opinion about whether to buy or sell a specific investment may be provided by third parties. The content is not intended to be a personal recommendation to buy or sell any financial instrument or product, or to adopt any investment strategy as it is not provided based on an assessment of your investing knowledge and experience, your financial situation or your investment objectives. The value of your investments, and the income derived from them, may go down as well as up. You may not get back all the money that you invest. The investments referred to in this article may not be suitable for all investors, and if in doubt, an investor should seek advice from a qualified investment adviser.
Full performance can be found on the company or index summary page on the interactive investor website. Simply click on the company's or index name highlighted in the article.
Disclosure
We use a combination of fundamental and technical analysis in forming our view as to the valuation and prospects of an investment. Where relevant we have set out those particular matters we think are important in the above article, but further detail can be found here.
Please note that our article on this investment should not be considered to be a regular publication.
Details of all recommendations issued by ii during the previous 12-month period can be found here.
ii adheres to a strict code of conduct. Contributors may hold shares or have other interests in companies included in these portfolios, which could create a conflict of interests. Contributors intending to write about any financial instruments in which they have an interest are required to disclose such interest to ii and in the article itself. ii will at all times consider whether such interest impairs the objectivity of the recommendation.
In addition, individuals involved in the production of investment articles are subject to a personal account dealing restriction, which prevents them from placing a transaction in the specified instrument(s) for a period before and for five working days after such publication. This is to avoid personal interests conflicting with the interests of the recipients of those investment articles.