Stockwatch: the yield curve and what it tells us about the stock market
24th January 2023 12:10
by Edmond Jackson from interactive investor
Is the yield curve really different this time, asks analyst Edmond Jackson, who discusses this key indicator and the clues it gives us about recession and the future for share prices.

The crux for equities is whether we experience a recession, hence a currently “inverted yield curve” tempts speculation.
This occurs when the bond market prices in higher returns from longer-dated assets, with the relationship between three-month and 10-year government bonds in most focus – as the preferred measure used by the US Federal Reserve governor when considering interest rate policy.
- Invest with ii: Top UK Shares | Share Tips & Ideas | Open a Trading Account
Normally, you would expect a higher return from the 10-year bond given greater uncertainty with the future, but when the yield curve is inverted it means near-term returns are higher.
We currently see three-month US Treasuries yielding 4.7% versus 3.5% for the 10-year bond:
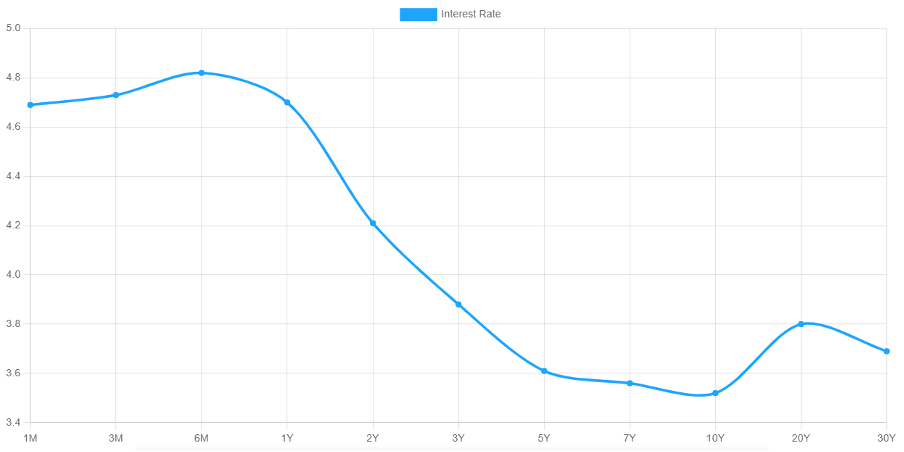
Source: https://www.ustreasuryyieldcurve.com
The relevance is that a three-month versus 10-year inversion has preceded all eight US recessions since 1968, with no false alarms.
An inversion currently applies to 28 other countries, including the UK, where three-month gilts offer 3.9% versus 3.4% on the 10-year.
It coincides with the EY consultancy this week downgrading its forecast for a contraction in UK gross domestic product – from 0.3% to 0.7% in 2023 - although it expects GDP to recover to 1.9% in 2024 and 2.2% in 2025.
That would be a modest slip compared with a 5.0% fall during 2009, admittedly the steepest annually since GDP records began in 1949.
Key figure in yield curve history doubts its ninth inversion
Campbell Harvey, an economics professor who effectively pioneered research linking the shape of the yield curve with the trend in US economic activity, is sceptical.
He contends that modern awareness of the yield curve means companies and consumers take risk-mitigating actions – such as increasing savings and avoiding major investments – which limits economic downside.
I think that is still liable to temper economic demand – “talking ourselves into a recession” – and it is unclear whether the managerial class is so attuned to what finance specialists take for granted.
More likely, the media seizes on any economic bad news to get people’s attention, making them cautious.
- Six speculative share ideas for 2023
- 2023 Investment Outlook: stock tips, forecasts, predictions and tax changes
- 11 ways to invest your ISA like Warren Buffett
You would think portfolio managers are well aware of the yield curve, yet its tilt into the greatest inversion in decades happened earlier this month – just as many funds piled into equities.
Harvey also contends that excess demand for labour enables those workers who unfortunately get laid off to find new jobs sooner than usual.
Certainly, a downturn is characterised by unemployment. “It’s a recession when your neighbour loses his job; it’s a depression when you lose yours,” said Harry S. Truman.
But a tight labour market could mean pay awards prop inflation at around 5%, requiring central banks to keep interest rates higher for longer. This could eventually tip the global economy into recession, or at least temper EY’s projections for UK recovery.
Harvey therefore implicitly assumes inflation will ease by saying: “If a recession arrives, it will be mild.”
Yet mid-single-digit inflation would still present dilemmas such as wealth erosion and rewarding borrowers (who would see the real value of debt fall over time) compared with 2% inflation, or lower, that we became accustomed to after tough monetary action in the 1980s.
Should you make adjustments for a genuine technical indicator?
The whole point of charts and the like – say a stop-loss level on an equity purchase – is not then making excuses for one thing after another.
I question such an approach because it assumes market prices are efficient, which only applies some of the time. Divining economic prospects is inherently uncertain. Yet I would certainly agree, for example, with having a mental sense of stop-loss in shares.
We often hanker after the simplest solution to explain things, hence the appeal of “Occam’s razor”, a problem-solving principle where you follow explanations involving the smallest possible set of elements.
One complexity, for example, is that if inflation does fall steadily in the long run, then adjusting for high inflation in the short term could mean 10-year yields are already above those for three months.
Paulsen Research disputes wider validity of the yield curve
US economist Jim Paulsen contends that while an inverted yield curve can portend recession, it makes no pragmatic sense to follow it because stock markets are quick to try and price in recovery.
He argues that inversions prove positive for equities. In all nine, historically, the S&P 500 index rose around 6% in the year after an inversion and 14% in the next year. In subsequent years thereafter, the index rose five out of nine times.
- Visit our YouTube channel to view our experts’ tips for 2023
- Where to invest in Q1 2023? Four experts have their say
Paulsen says: “While yield-curve inversions have customarily unleashed havoc on the economy, job creation and even profits, they are not nearly as bad for the economy as commonly advertised.”
Losses are small when stocks discount economic slowdown before the yield curve inverts. For example, in 2019 the S&P 500 had already dropped 20% before the yield curve inverted. The index subsequently performed well until Covid struck in early 2020.
I would mind how asset prices have benefited in recent decades from very low interest rates, whereas we may be moving to a situation of mid-single-digit rates to check inflation.
Alan Greenspan still regards a US recession as the ‘most likely outcome’
The retired chair of the Fed from 1987 to 2006 is more pessimistic, likewise former New York Fed president William Dudley. One has to hope, aged 96 and 70 respectively, that older age makes them inherently more cautious.
Plenty of old-timers on the investment scene – such as Jim Rogers, Jeremy Grantham and Stanley Druckenmiller – have for years predicted equities to fall as the era of economic stimulus measures fades.
Yet Ed Yardeni in the US – originally a Prudential Bache analyst, nowadays with his own forecasting firm – has one of the best records as a stock market strategist, going back to the 1980s, and he contends that a new bull market is under way after a bottom last October.
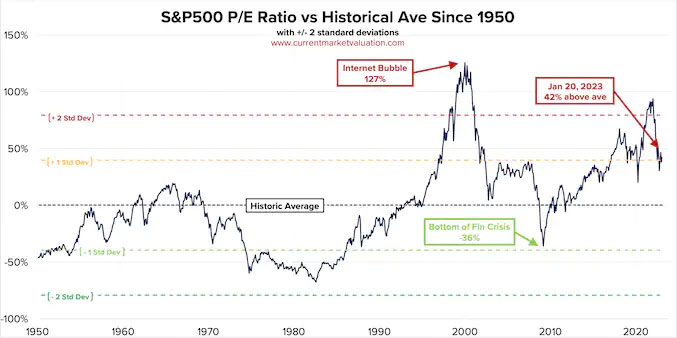
I would take care given that the trailing price/earnings (PE) multiple on the S&P 500 index is 28.6 times, or 42% above its modern-era average of 19.6 times. That plays to pundits such as Jeremy Grantham who argue in favour of mean-reversion, hence equities look exposed in the event of a recession.
Best not rely on one indicator alone
This article hopefully shows the yield curve is no panacea for equity decisions. Like much in economic life, the deeper you delve the less secure enough such models may prove.
It is possible to pull apart key arguments of economics professors, and the more gurus you explore the more they represent a “normal distribution” (as statisticians would say) of opinion.
One key reason the FTSE 100 index of largely international firms rose last week, was the World Economic Forum at Davos appearing to suggest the global outlook is not quite as bad as feared.
Sentiment seems likely to continue to twitch, as expressed by the yield curve. You also cannot anticipate “black swan” events – positive or negative – which can be the most influential for investing.
It should remind us that taking a diversified approach, and not expecting to be too clever on timing, is an intelligent course of action.
Edmond Jackson is a freelance contributor and not a direct employee of interactive investor.
These articles are provided for information purposes only. Occasionally, an opinion about whether to buy or sell a specific investment may be provided by third parties. The content is not intended to be a personal recommendation to buy or sell any financial instrument or product, or to adopt any investment strategy as it is not provided based on an assessment of your investing knowledge and experience, your financial situation or your investment objectives. The value of your investments, and the income derived from them, may go down as well as up. You may not get back all the money that you invest. The investments referred to in this article may not be suitable for all investors, and if in doubt, an investor should seek advice from a qualified investment adviser.
Full performance can be found on the company or index summary page on the interactive investor website. Simply click on the company's or index name highlighted in the article.
Disclosure
We use a combination of fundamental and technical analysis in forming our view as to the valuation and prospects of an investment. Where relevant we have set out those particular matters we think are important in the above article, but further detail can be found here.
Please note that our article on this investment should not be considered to be a regular publication.
Details of all recommendations issued by ii during the previous 12-month period can be found here.
ii adheres to a strict code of conduct. Contributors may hold shares or have other interests in companies included in these portfolios, which could create a conflict of interests. Contributors intending to write about any financial instruments in which they have an interest are required to disclose such interest to ii and in the article itself. ii will at all times consider whether such interest impairs the objectivity of the recommendation.
In addition, individuals involved in the production of investment articles are subject to a personal account dealing restriction, which prevents them from placing a transaction in the specified instrument(s) for a period before and for five working days after such publication. This is to avoid personal interests conflicting with the interests of the recipients of those investment articles.