Three of America’s top companies, but only one is a buy
22nd October 2021 09:25
by Rodney Hobson from interactive investor
As businesses try to pass on higher costs to customers, our overseas investing expert gives his view on results from these household names.

Rodney Hobson is an experienced financial writer and commentator who has held senior editorial positions on publications and websites in the UK and Asia, including Business News Editor on The Times and Editor of Shares magazine. He speaks at investment shows, including the London Investor Show, and on cruise ships. His investment books include Shares Made Simple, the best-selling beginner's guide to the stock market. He is qualified as a representative under the Financial Services Act.
Early signs that life is getting tougher for American companies are filtering through in the latest corporate updates. Investors need to tread carefully as rising input prices, added to distribution difficulties, force companies to try to pass price rises on to their own customers. There is inevitably a time lapse in recovering added costs, during which the unfortunate combination of rising revenue but falling profits is likely to occur.
- Invest with ii: Top US Stocks | US Earnings Season | Open a Trading Account
Consumer goods supplier Procter & Gamble (NYSE:PG) is a typical case. Its quarterly results to 30 September, the first three months of its financial year, showed net sales up 5.3% to $20.34 billion on the previous first quarter, but pre-tax profits slipped 4.9% to $5.04 billion. Gross margins were squeezed from 52.7% to 49%.
- US bank sector review: stocks to buy, hold and sell
- Want to buy and sell international shares? It’s easy to do. Here’s how
- Read more of Rodney's articles here
Procter is still forecasting that net sales will rise 2-4% over the current financial year from the $76.12 billion raked in during 2020-21. The first quarter suggests that will be achieved, with a little on top as well. Whether a rise in net earnings per share of 6-9% will also be achieved is more problematic after slippage from $1.63 to $1.61 in the first three month. The company’s own prognosis suggests its annual costs will rise by $2.1 billion, with an extra $200 million going on freight costs.
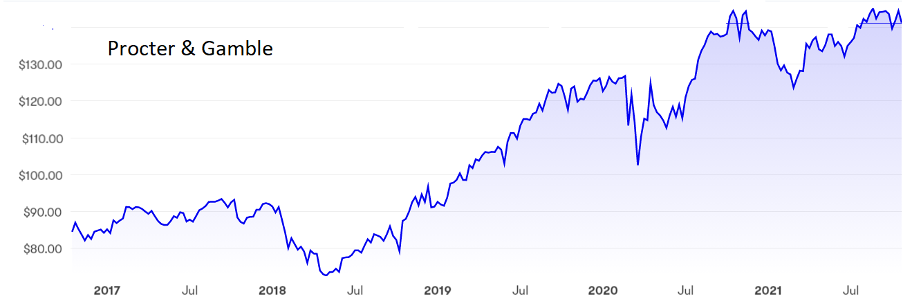
The shares have doubled in the past three-and-a-half years, but they have baulked at $144 several times in the past 12 months, and they dropped 1.2% in an immediate reaction to the figures. They are unlikely to break the ceiling before the next update, while the downside potential could be below $130. The one possible saving grace is the yield of 2.4%.

Source: interactive investor. Past performance is no guide to future performance
Tobacco maker Philip Morris International (NYSE:PM) put out a contrasting update but, while its products are quite different to Procter’s, the problems are similar. Third-quarter earnings of $1.58 were actually 11.3% higher compared with the previous year and slightly higher than analysts expected, but the shares still dropped nearly 2%. Revenue rose 9.1% to $8.12 billion, also better than expected, as higher shipments of its heated tobacco product pushed volumes up 2.1%, but once higher taxes are deducted the sales growth was a more modest 5.7%.
Tobacco companies have a habit of defying attempts by finance and health ministers to persuade addicts to quit, but Morris has scaled down full-year expectations for earnings to $6.01-6.06 compared with analysts’ expectations of $6.08.
Morris has just completed the acquisition of asthma drug maker Vectura after buying another pharmaceutical company, Fertin Pharma, but so far it has attracted opprobrium for perceived hypocrisy rather than improving its ethical image.
The recovery in the share price from pandemic lows has run out of puff. This could be the start of another long slide.

Source: interactive investor. Past performance is no guide to future performance
Healthcare group Johnson & Johnson (NYSE:JNJ) also provided a mixed picture. It fell short of expectations for total sales despite a 10.7% increase to $23.34 billion thanks to a strong recovery in its medical devices division. Investors may be slightly sceptical about J&J maintaining its guidance for the full year.
Sales of its single-shot Covid-19 vaccine disappointed. However, as the vaccine is being sold at cost this will not have an impact on profits.
On the positive side, net earnings beat forecasts with a 3.2% rise to $3.67 billion, a commendable if unspectacular performance. It is true there was a 13% fall at the pre-tax level, but J&J calmed shareholders’ concerns by raising its guidance for the full year.

Source: interactive investor. Past performance is no guide to future performance
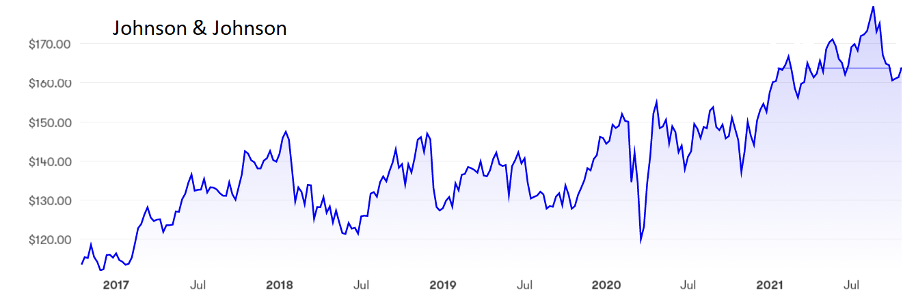
The shares are down on the $180 peak reached in August but there looks to be support around $160. The recent weakness presents a buying opportunity, given that an ageing global population means the products will continue to be in demand.
Hobson’s choice: take profits at Procter & Gamble while you can still get more than $140. Although I suggested buying at that level in April, I have lost enthusiasm. Sell Philip Morris – the long-term future is too clouded. Buy Johnson & Johnson below $166, where the yield is 2.5%. I recommended the shares at $134 two years ago and $144 last October. They should continue to show unspectacular but solid progress.
These articles are provided for information purposes only. Occasionally, an opinion about whether to buy or sell a specific investment may be provided by third parties. The content is not intended to be a personal recommendation to buy or sell any financial instrument or product, or to adopt any investment strategy as it is not provided based on an assessment of your investing knowledge and experience, your financial situation or your investment objectives. The value of your investments, and the income derived from them, may go down as well as up. You may not get back all the money that you invest. The investments referred to in this article may not be suitable for all investors, and if in doubt, an investor should seek advice from a qualified investment adviser.
Full performance can be found on the company or index summary page on the interactive investor website. Simply click on the company's or index name highlighted in the article.