10-year market round-up: When equities were king
Here’s how global stock markets performed in the past decade; who did best and the underachievers.
31st December 2019 10:33
by Graeme Evans from interactive investor
Here’s how global stock markets performed in the past decade; who did best and the underachievers.
A decade in which equities have comfortably outperformed other asset classes is ending with the FTSE 100 index and other global stock markets trading at or near to record highs.
An estimated $25 trillion has been added to the value of world stocks over 10 years, aided by rock-bottom interest rates and the longest economic cycle in history.
That's produced quite a return for investors, including those with exchange-traded funds (ETFs) set up to track the performance of the FTSE 100 index. According to data from SharePad, London's top-flight index is up 41.5% since the start of 2010, or a total return of 107% when dividend reinvestment is factored in.
The numbers are even more impressive for the domestic-focused FTSE 250, with a total return of 211%. This means £100 invested at the start of the decade has since grown to £311.
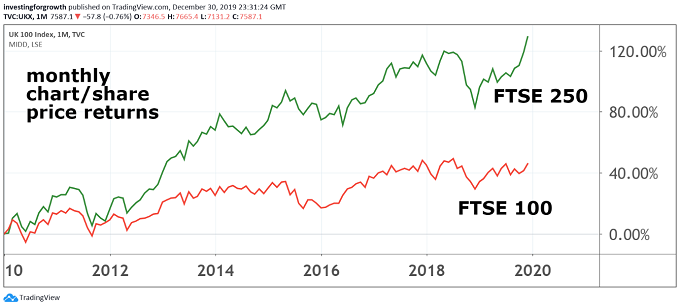
Source: TradingView Past performance is not a guide to future performance
Contrast this with the negative performance of cash savings, where £100 is now worth less in real terms due to the erosive force of inflation, plus the impact of a Bank of England base rate that's barely moved from the record low of 0.5% set in March 2009.
Despite the financial crisis now being more than a decade ago, the UK's fragile and Brexit-hit economy seems no closer to being weaned off its monetary and fiscal stimulus. The measures have included large scale asset purchases known as quantitative easing (QE), which many commentators believe have artificially inflated stock markets worldwide.
A decade of ultra-low interest rates has also made it much easier for companies to load up on debt, with one of the consequences being a surge in shareholder returns. Link Asset Services expects a record UK dividend haul of £110.3 billion for 2019, with UK shares currently yielding 4.4% over the next 12 months – a level well ahead of other asset classes.
Share buy-backs have also become commonplace, enabling companies to flatter their earnings per share performance through the purchase of their own stock.
With such unprecedented conditions helping investors to reap the rewards from a decade-long bull market, it's unsurprising that they have become increasingly jittery about when the party might come to an end. These late-cycle nerves rocked markets in the latter part of 2018, when the FTSE 100 index tumbled 3% in one session.
That year ended up being the worst of the decade for global markets, with London's 12.5% decline in 2018 driven by commodity-based stocks amid worries about global growth.
- Is the growth investing boom about to end with a bang?
- You can also invest in UK equities via ii’s Super 60 recommended funds. Click here to find out more
The expectation last Christmas that 2019 would see the end of the economic cycle also proved wide of the mark, with three interest rate cuts by the US Federal Reserve going some way to propping up confidence in the second half of this year. Policymakers also injected capital into money markets in September in order to address volatile lending conditions.
That's given fresh impetus to Wall Street, with the Dow Jones Industrial Average and tech-laden Nasdaq at record highs in recent days and the S&P 500 heading for its best year since 1997.
The Nasdaq 100 is comfortably the best-performing stock market of the decade, up 372%, reflecting the rise of FAANG stocks — Facebook (NASDAQ:FB), Amazon (NASDAQ:AMZN), Apple (NASDAQ:AAPL), Netflix (NASDAQ:NFLX) and Google-owner Alphabet (NASDAQ:GOOGL) — and the rapid advance of technology in our daily lives.
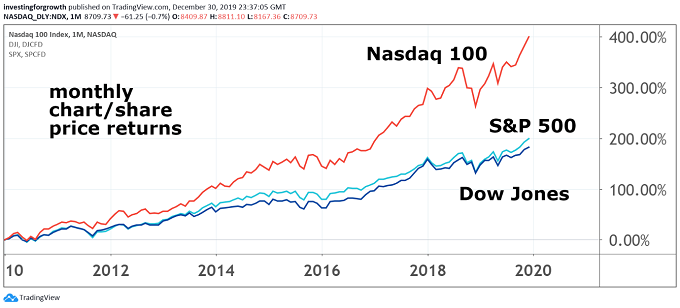
Source: TradingView Past performance is not a guide to future performance
FAANG stocks are now collectively worth almost US$4 trillion, which, according to Reuters, is equivalent to 7% of the MSCI global equity index. The figure, which is more than the economic output of the UK, compares with just $100 billion for FAANGs at the start of the decade.
The UK's equivalent index, the FTSE TechMARK, is up 172% over the decade and has performed much better than the FTSE 100. London's top-flight is currently about 300 points away from the record intraday high set in May 2018 of 7,903, having started 2010 at 5,400 as part of a recovery from the financial crisis low of less than 4,000 in early 2009.
The UK has been “uninvestable” in recent years according to a number of international institutional investors, meaning it has largely missed out on recent global rallies due to Brexit uncertainty. This perception looks to be changing, with December's election result ensuring the FTSE 100 is on track for its best annual performance since 2016.
- Here’s where you think the FTSE 100 will finish in 2020
- Get exposure to the world’s biggest companies via these ii Super 60 recommended funds
That was the year the top-flight surged more than 14% on global hopes of a spending spree by the then US president-elect Donald Trump. London-listed mining shares did particularly well in 2016, with the slump in the pound in the wake of the EU referendum also helping to boost the appeal of dollar earners in London.
It's been a disappointing decade, however, for followers of developing economies and emerging markets. A strong dollar and slowing Chinese economy have been among factors responsible for the under-performance of Asia-focused indices, with the Hang Seng in Hong Kong up 29% over the decade and the FTSE China 50 Index ahead by just 4%.
Full performance can be found on the company or index summary page on the interactive investor website. Simply click on the company's or index name highlighted in the article.
These articles are provided for information purposes only. Occasionally, an opinion about whether to buy or sell a specific investment may be provided by third parties. The content is not intended to be a personal recommendation to buy or sell any financial instrument or product, or to adopt any investment strategy as it is not provided based on an assessment of your investing knowledge and experience, your financial situation or your investment objectives. The value of your investments, and the income derived from them, may go down as well as up. You may not get back all the money that you invest. The investments referred to in this article may not be suitable for all investors, and if in doubt, an investor should seek advice from a qualified investment adviser.
Full performance can be found on the company or index summary page on the interactive investor website. Simply click on the company's or index name highlighted in the article.