Can oil price's upward trend continue?
With the oil price rising fast, a financial markets analyst tells us where he thinks it's going next.
27th March 2019 11:55
by Rajan Dhall from interactive investor
With the oil price rising fast, a financial markets analyst tells us where he thinks it's going next.

Oil markets have been pushing higher recently as Saudi and Russian oil production seems to be slowing. Some other OPEC countries have also cut output by more than expected as the OPEC+ coalition attempts to balance the market.
Just yesterday, Russian Energy Minister Alexander Novak, said the country will have cut its output by 228,000 barrels per day by the end of the month after seemingly dragging its feet over the past year.
Another factor supporting oil markets is confusion in the US administration over what to do about Iranian sanctions. It has been said that Trump's team is deeply divided over whether to let a small group of countries keep buying Iranian oil.
The main supply issue lies with the US where production has been steadily ramped up to deal with last summer's demand. But one would have expected production levels to fall back again now that demand has normalised.
Looking at the latest Departmet of Energy (DoE) and American Petroleum Institute (API) inventory levels in November 2018, there was a notable rise. This was probably to replenish stocks lost in the summer but, since January, there has been a lower average reading. That said, there has only been a draw on half of the last 12 weekly readings.
The DoE's readings have come in lower than expectations six times out of the last 11 so, if we get a lower reading today, the ratio could be significantly better.
Looking at the technicals on the daily WTI rolling futures contract, it seems there is a near-term resistance level at $60.39.
The market has been on a long bull run since the lows seen on the chart just before 2019. The trend still looks clear to continue but there may be a retracement in the making as we have nearly breached the midpoint of yesterday's daily candle.
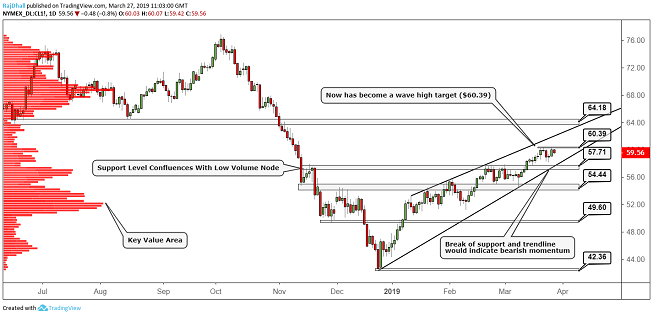
Source: TradingView Past performance is not a guide to future performance *'Support level confluences with low volume node' refers to a support level which coincides with a price where not many contracts were exchanged (low volume node).
If the price closes below $59.04 per barrel it would give us an 'outside day' and indicate some more bearish momentum.
Interestingly, if the price does move lower to the $57.71 per barrel support level, this confluences with an area of low volume on the composite market profile on the left-hand side of the chart.
This is where fewer contracts exchanged and at what price, which can give a good indication of support and resistance. Conversely, longer-term, if $60.39 per barrel is broken the next resistance target is $64.18 per barrel.
Full performance can be found on the company or index summary page on the interactive investor website. Simply click on the company's or index name highlighted in the article.
These articles are provided for information purposes only. Occasionally, an opinion about whether to buy or sell a specific investment may be provided by third parties. The content is not intended to be a personal recommendation to buy or sell any financial instrument or product, or to adopt any investment strategy as it is not provided based on an assessment of your investing knowledge and experience, your financial situation or your investment objectives. The value of your investments, and the income derived from them, may go down as well as up. You may not get back all the money that you invest. The investments referred to in this article may not be suitable for all investors, and if in doubt, an investor should seek advice from a qualified investment adviser.
Full performance can be found on the company or index summary page on the interactive investor website. Simply click on the company's or index name highlighted in the article.