Chart of the week: is BT now poised for a major rally?
The communications giant’s share price shows the classic signs of a bear market ending.
14th September 2020 14:07
by John Burford from interactive investor
The communications giant’s share price shows the classic signs of a bear market ending, according to our chartist.

I last covered this bombed-out warhorse in May, when its shares had declined in a strong bear trend to the £1 region – a decade-old low. I made a case that odds heavily favoured a rally phase off this low that should last for weeks or months.
Although the share price has gone absolutely nowhere since then, the evidence for a hefty advance now has grown much stronger.
This was the long-range chart I showed in May:
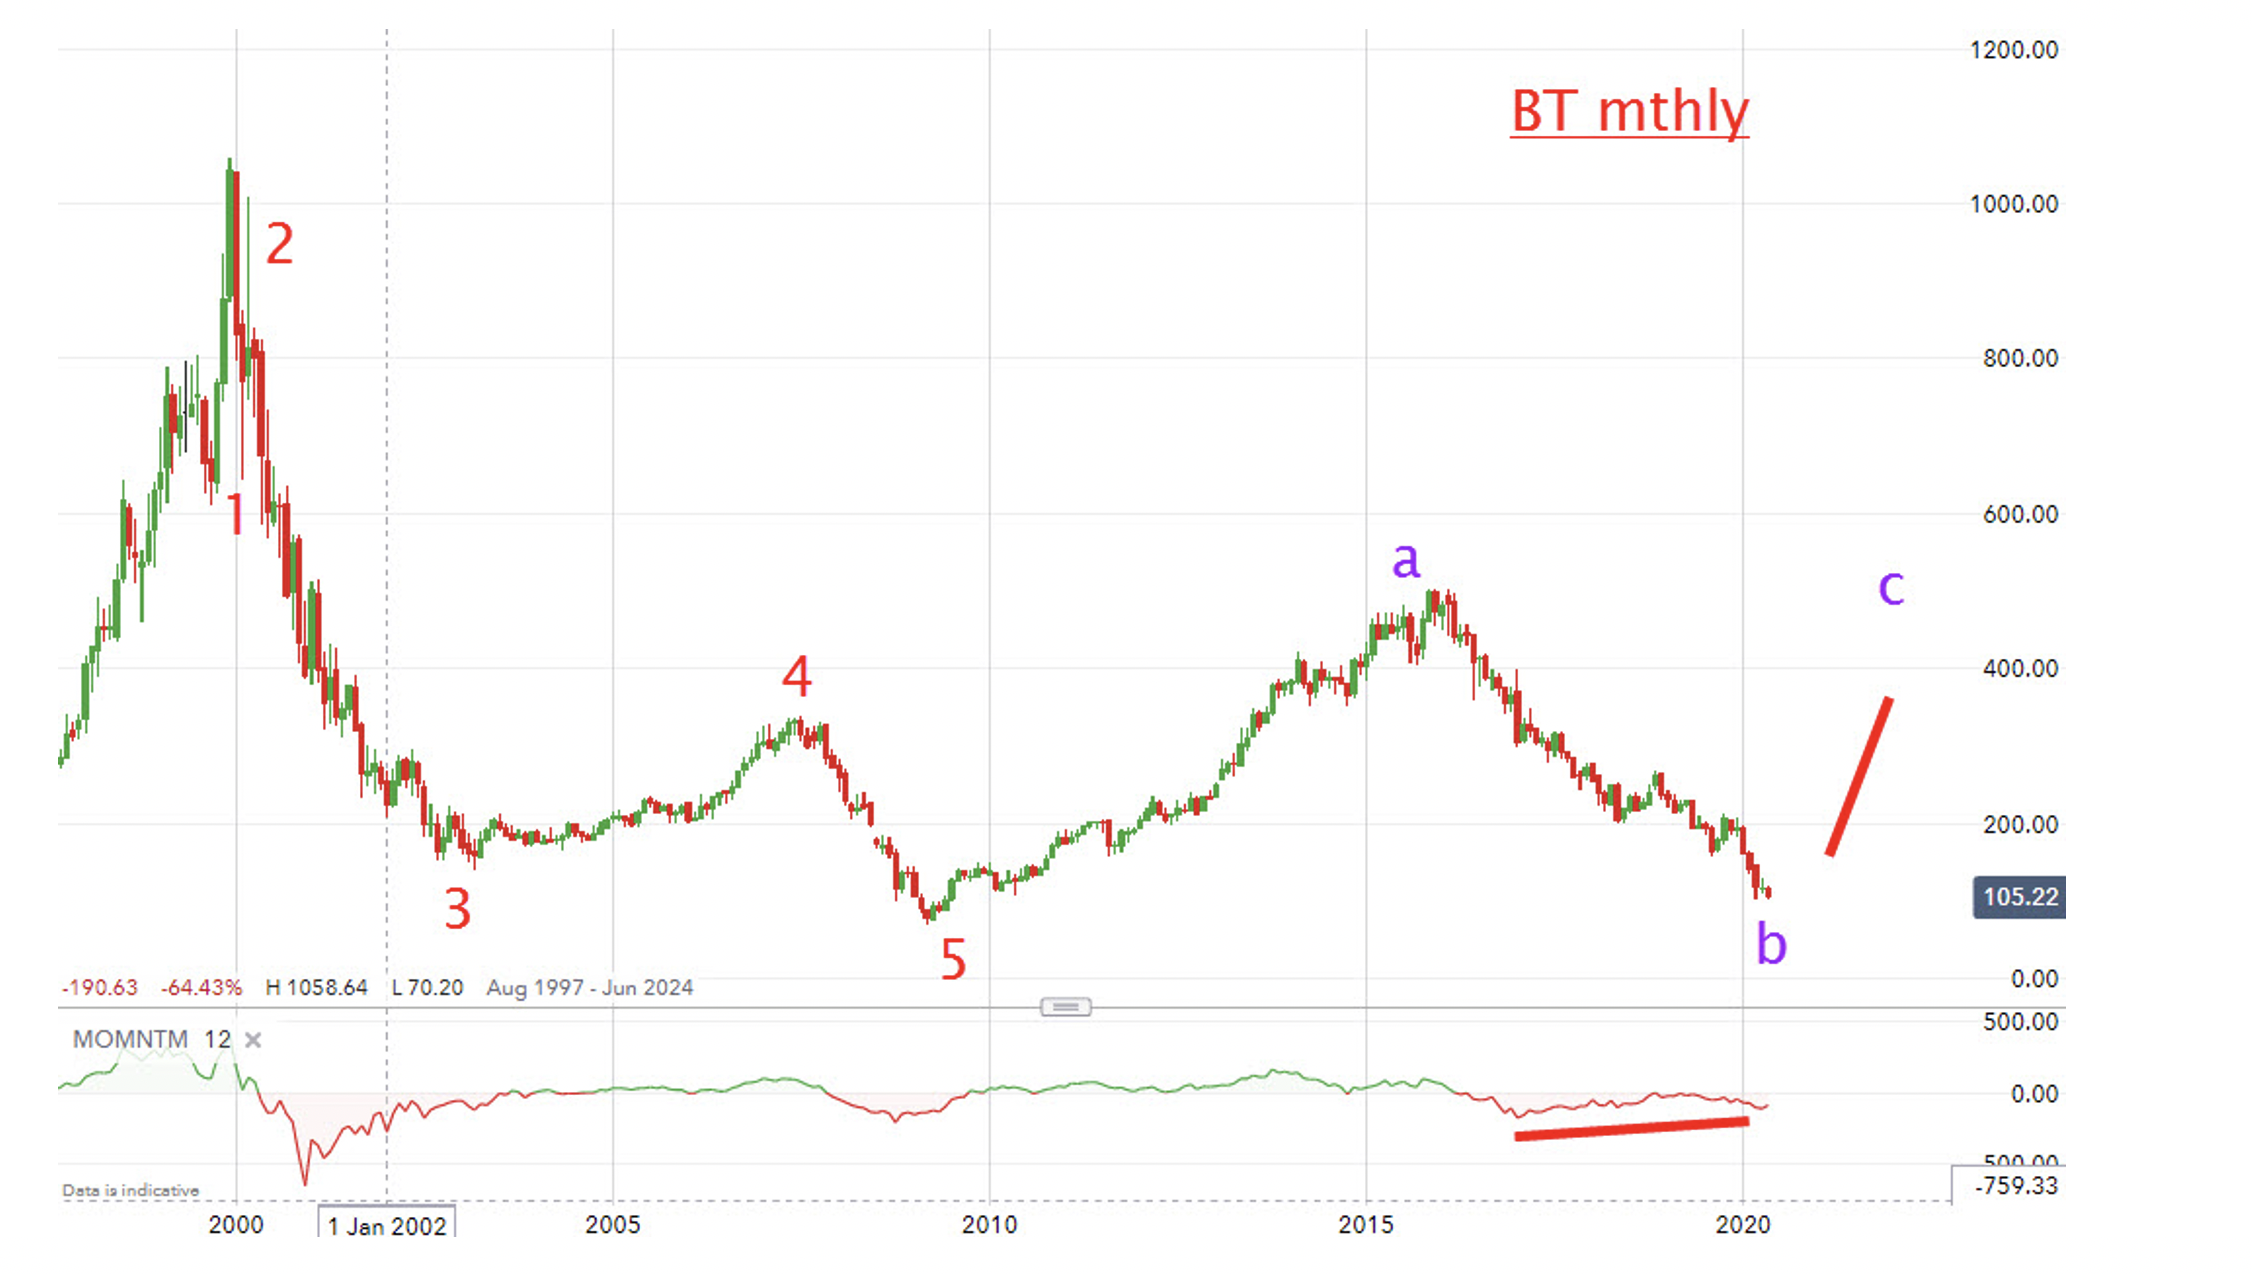
Source: interactive investor. Past performance is not a guide to future performance.
The key point from my wave labels is that we are finishing up the “b” wave prior to the start of the “c” wave up. This wave should at least go on to test the area of the “a” wave high around 500p. If so, that places BT (LSE:BT.A) as a possible high-flyer.
- Chart of the week: is bombed-out BT finally a massive buy?
- Stockwatch: is it finally time to buy BT shares?
- ii view: BT makes tough decision on dividend
Note also the very strong momentum divergence (lower red bar) indicating that as the “b” wave moved lower, the selling pressure became weaker. When this happens, it is likely the shares are moving into stronger hands from the weaker ones that are disappointed by the suspension of the dividend until at least 2021-2022.
That makes the shares unattractive to income-seeking investors such as pension funds, but very attractive to capital-gains seeking investors.
With the technical picture appearing very favourable, as well as my high price target, I believe the shares are well worth a very hard look. And the wave pattern since May on the daily chart has bolstered my belief:
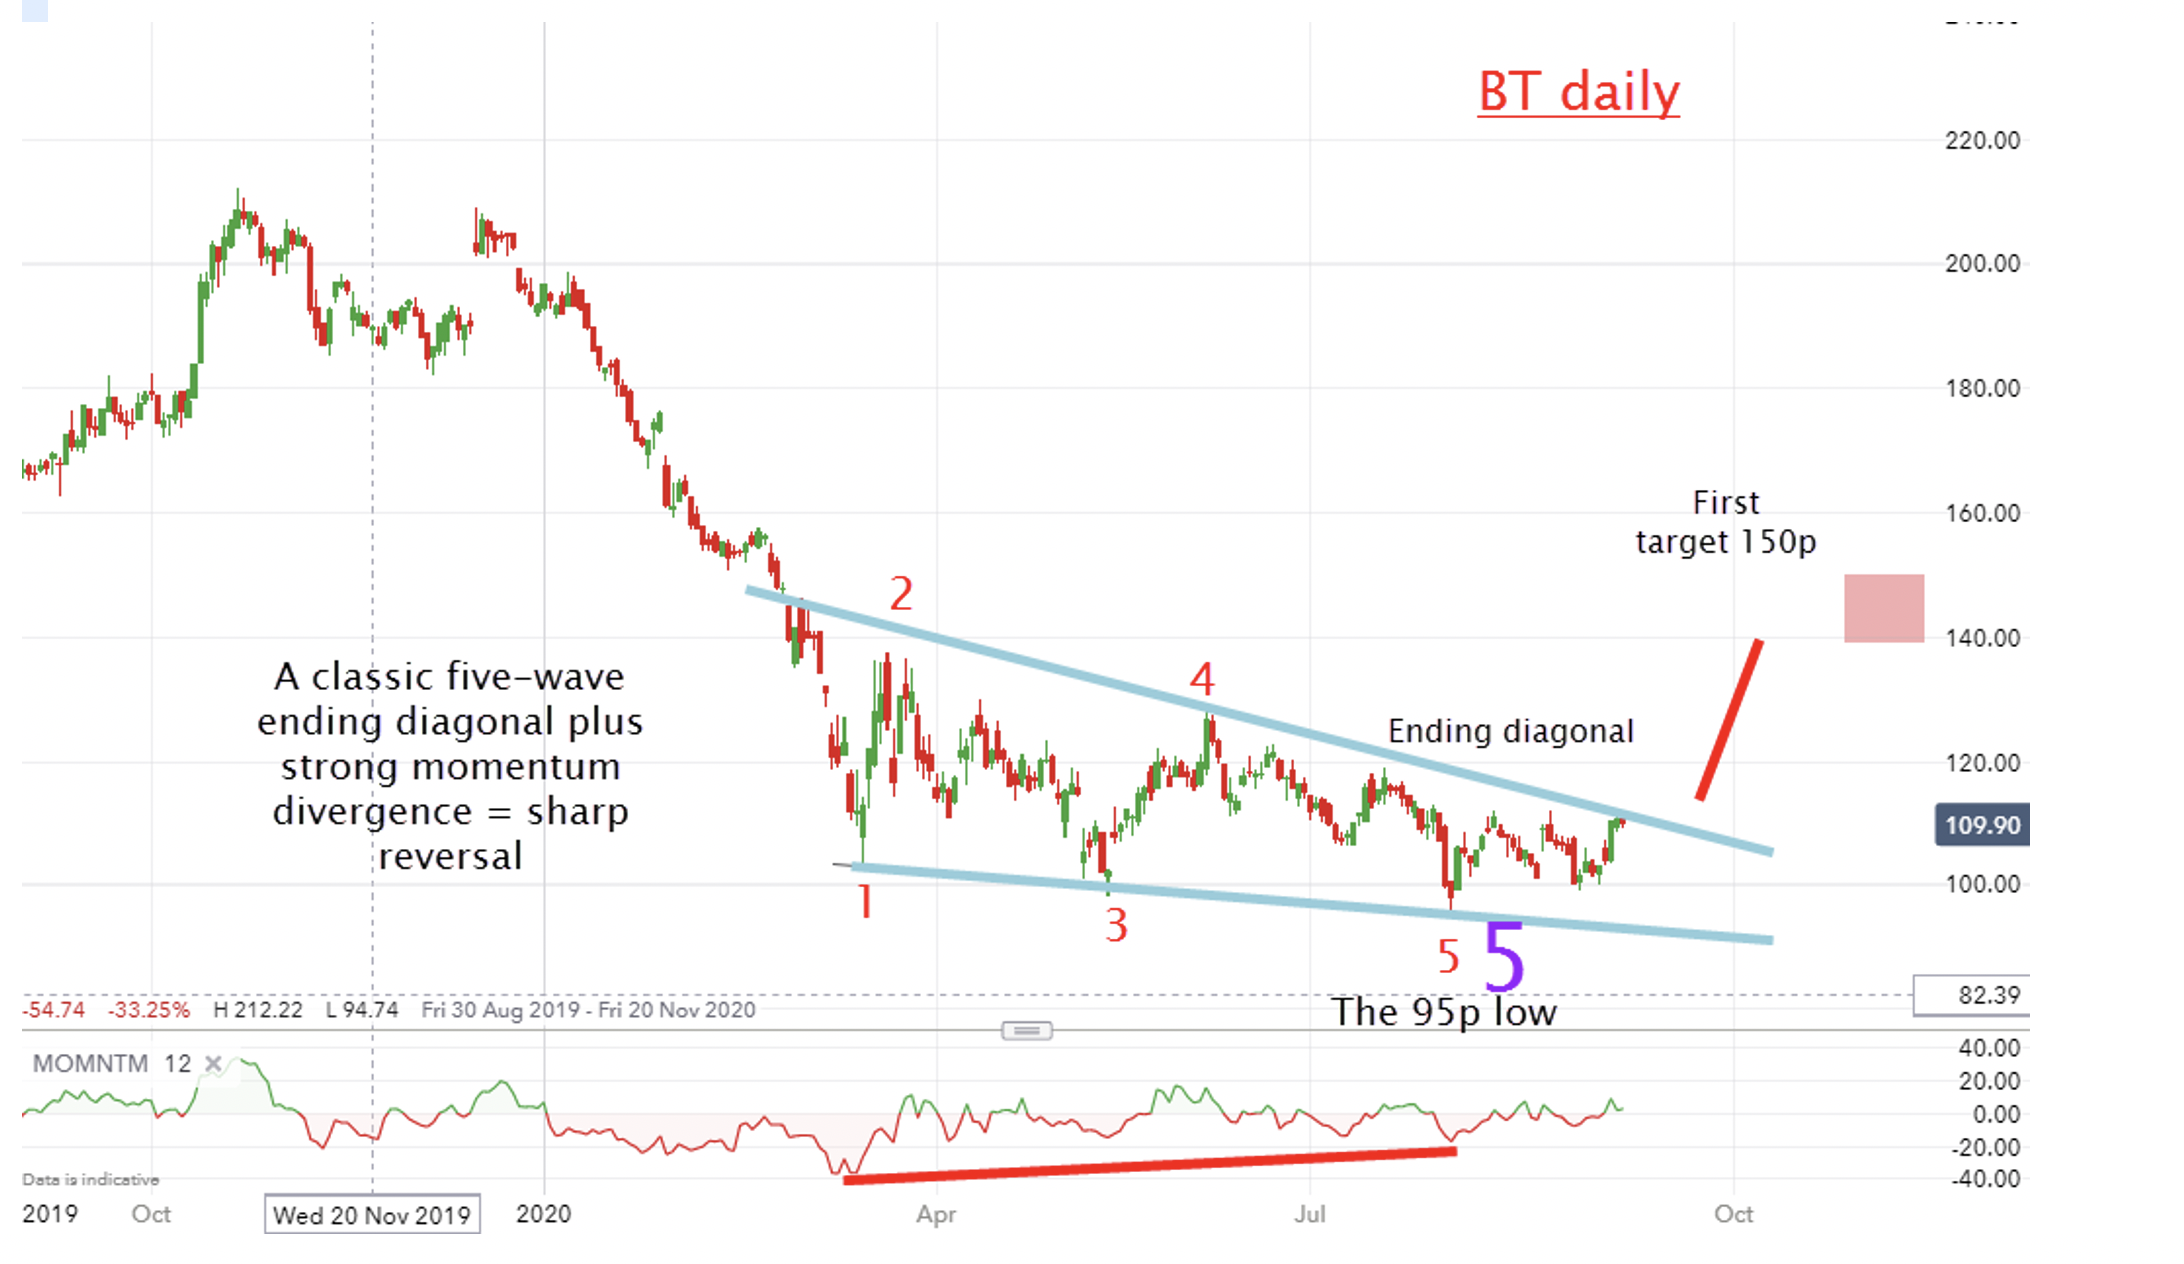
Source: interactive investor. Past performance is not a guide to future performance.
Since May, the shares have gone nowhere – but the “how” behind this tells an important story (to chart technicians, at least). In fact, the pattern is a classic five-wave ending diagonal appearing at the end of a massive bear market. This is a textbook bear-market ending pattern.
Right now, the shares are poised to break above the upper diagonal line. When they do, my first target becomes the 150p area. Given the strong momentum divergence on this daily chart (to match that on the weekly), I expect my target to be reached quite quickly. I place low odds on new lows, but if so the shares are an even a stronger “buy” given takeover rumours.
Recently, we have seen the big-name tech shares coming off their perches (see my latest columns), so is this the time for value shares to shine? If so, then the old “buy low, sell high” investing method will really come into its own – at long last.
For more information about Tramline Traders, or to take a three-week free trial, go to www.tramlinetraders.com.
John Burford is the author of the definitive text on his trading method, Tramline Trading. He is also a freelance contributor and not a direct employee of interactive investor.
Disclosure
We use a combination of fundamental and technical analysis in forming our view as to the valuation and prospects of an investment. Where relevant we have set out those particular matters we think are important in the above article, but further detail can be found here.
Please note that our article on this investment should not be considered to be a regular publication.
Details of all recommendations issued by ii during the previous 12-month period can be found here.
ii adheres to a strict code of conduct. Contributors may hold shares or have other interests in companies included in these portfolios, which could create a conflict of interests. Contributors intending to write about any financial instruments in which they have an interest are required to disclose such interest to ii and in the article itself. ii will at all times consider whether such interest impairs the objectivity of the recommendation.
In addition, individuals involved in the production of investment articles are subject to a personal account dealing restriction, which prevents them from placing a transaction in the specified instrument(s) for a period before and for five working days after such publication. This is to avoid personal interests conflicting with the interests of the recipients of those investment articles.
These articles are provided for information purposes only. Occasionally, an opinion about whether to buy or sell a specific investment may be provided by third parties. The content is not intended to be a personal recommendation to buy or sell any financial instrument or product, or to adopt any investment strategy as it is not provided based on an assessment of your investing knowledge and experience, your financial situation or your investment objectives. The value of your investments, and the income derived from them, may go down as well as up. You may not get back all the money that you invest. The investments referred to in this article may not be suitable for all investors, and if in doubt, an investor should seek advice from a qualified investment adviser.
Full performance can be found on the company or index summary page on the interactive investor website. Simply click on the company's or index name highlighted in the article.