Chart of the week: can Rolls-Royce shares almost double from here?
28th March 2022 11:35
by John Burford from interactive investor
Shares in the blue-chip engineer spiked higher last week, piquing the interest of technical analyst John Burford. Here are his findings.

Shares in this FTSE 100 engineering giant have certainly not been setting altitude records – unlike their revolutionary all-electric airplane The Spirit of Innovation that has clocked up speeds of more than 600 km/hr over distance. Not only that, it has recorded the fastest climb to 3,000 metres.
Rolls-Royce (LSE:RR.) shares have languished under the weight of the considerable negatives of the global lockdowns that crippled air travel and the large debt load in the new era of rising interest rates. And the weak share performance has reflected these short-term factors.
But has the current low price discounted most or all of the bad news? I believe so and the shares are back on my buy low/sell high list.
- Invest with ii: Top UK Shares | Share Prices Today | Open a Trading Account
Looking longer term, with their fuel-saving gas turbine power gearbox that should make major inroads in the recovering long-haul jet engine market – and their ‘mini nukes’ nuclear power generators that are now getting government backing – have the shares fully discounted the negatives and are they about to gain some altitude?
- ii view: Rolls-Royce CEO Warren East hands in his notice
- Shares, funds and trusts for your ISA in 2022
- Why reading charts can help you become a better investor
Incidentally, their ‘mini nukes’ take up the space of only two football pitches and can provide base load power for up to 500,000 homes – enough for many cities. But the lead time for installation is measured in a few years.
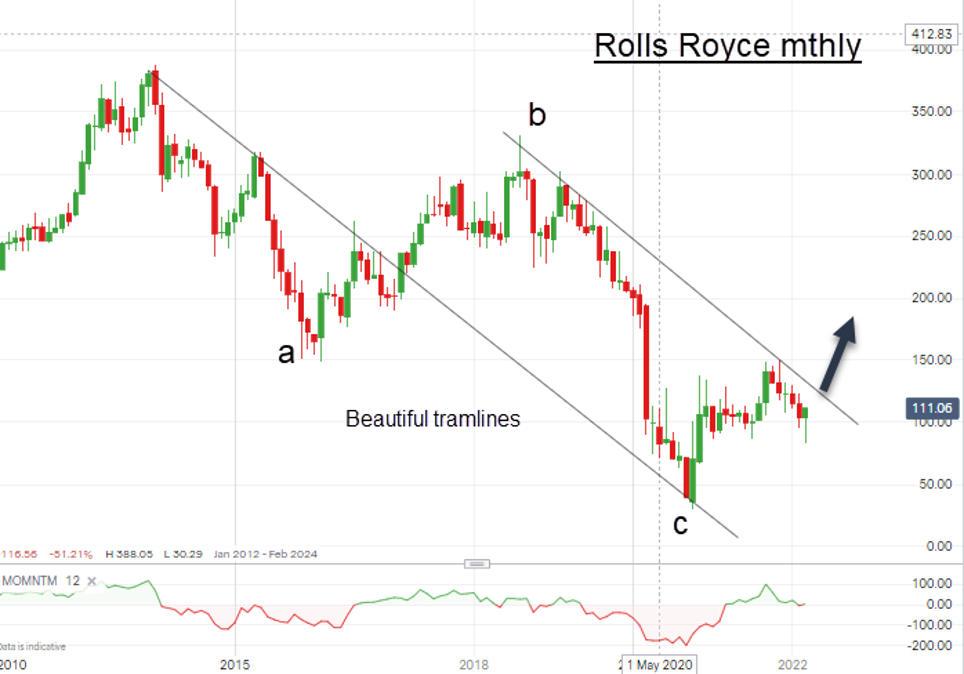
Here is the long-term chart showing the weakness the shares have endured since the heady days of 2013 when they reached a height of 387p. From there, they have descended in three clear mega-waves to the corona crash low of 30p in October 2020 – a staggering loss of 92%, which is when all seemed lost. Of course, that is the ideal time to make investments.

Past performance is not a guide to future performance.
Right away, it is clear that my tramline pair has acted as serious lines of support and resistance since January 2014. Thus, any clear upward break of the upper tramline above 130p would very likely be a major trend-setting event.
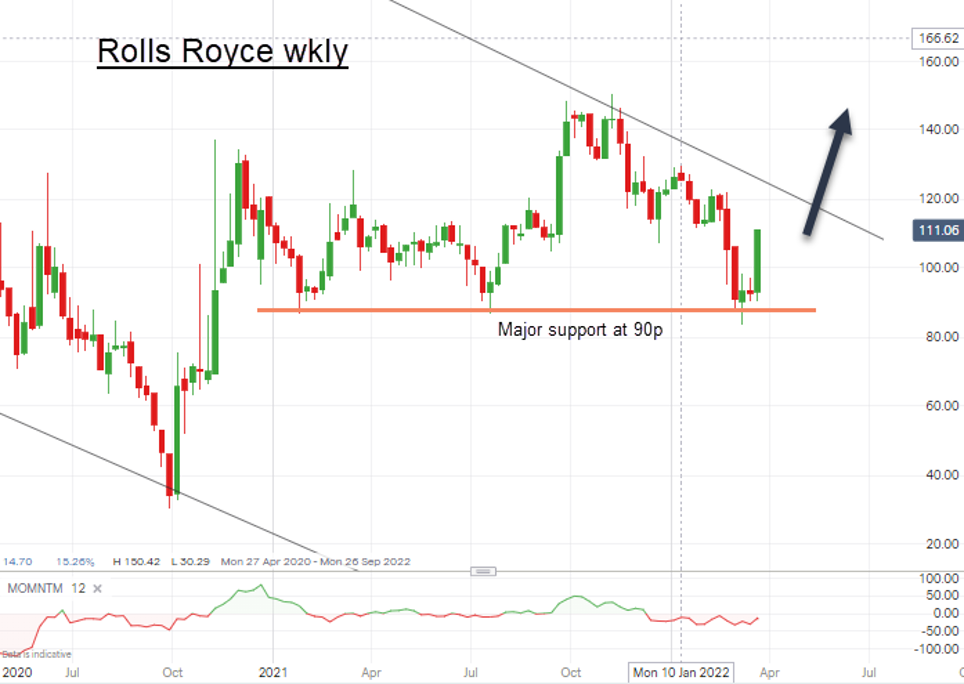
Here is the latest activity in more detail:

Past performance is not a guide to future performance.
After testing the upper tramline last year, the shares came back to test the pink major support area at 90p last month which held and, on Friday, the shares jumped by over 15% to confirm the likely path of least resistance is now up. But today (Monday), the shares have dropped back.
But provided the 90p support holds, the shares should move up to the upper tramline around the 125p area. A clear break there should propel them to 150p, with much higher potential to my first major target at around 180p.
John Burford is a freelance contributor and not a direct employee of interactive investor.
These articles are provided for information purposes only. Occasionally, an opinion about whether to buy or sell a specific investment may be provided by third parties. The content is not intended to be a personal recommendation to buy or sell any financial instrument or product, or to adopt any investment strategy as it is not provided based on an assessment of your investing knowledge and experience, your financial situation or your investment objectives. The value of your investments, and the income derived from them, may go down as well as up. You may not get back all the money that you invest. The investments referred to in this article may not be suitable for all investors, and if in doubt, an investor should seek advice from a qualified investment adviser.
Full performance can be found on the company or index summary page on the interactive investor website. Simply click on the company's or index name highlighted in the article.
Disclosure
We use a combination of fundamental and technical analysis in forming our view as to the valuation and prospects of an investment. Where relevant we have set out those particular matters we think are important in the above article, but further detail can be found here.
Please note that our article on this investment should not be considered to be a regular publication.
Details of all recommendations issued by ii during the previous 12-month period can be found here.
ii adheres to a strict code of conduct. Contributors may hold shares or have other interests in companies included in these portfolios, which could create a conflict of interests. Contributors intending to write about any financial instruments in which they have an interest are required to disclose such interest to ii and in the article itself. ii will at all times consider whether such interest impairs the objectivity of the recommendation.
In addition, individuals involved in the production of investment articles are subject to a personal account dealing restriction, which prevents them from placing a transaction in the specified instrument(s) for a period before and for five working days after such publication. This is to avoid personal interests conflicting with the interests of the recipients of those investment articles.