Chart of the week: follow big money back into Apple or take profits?
15th August 2022 13:58
by John Burford from interactive investor
Signs of recovery in this US tech share is piquing investors’ interest, but is it anything more than bullish mania, asks technical analyst John Burford.

Some of the big-name US tech shares are seeing better days since the end of the first half of the year and many mainstream media pundits are getting very excited. They are seeing blue skies ahead as they cite the tech-heavy Nasdaq now advancing 20% off its 16 June low.
Conventional analysts look at a 20% recovery as the resumption of the bull market, I do not. In fact, I believe this is wishful thinking.
Of the components of the ‘FAANG gang’, only Apple (NASDAQ:AAPL) has made considerable inroads into the losses off its January $184 all-time high (currently trading at $171). Of the others, Meta Platforms (NASDAQ:META) is still down 53% off its $384 September 2021 all-time high.
- Discover more: Buy international shares | Interactive investor Offers | Most-traded US stocks
Amazon.com Inc (NASDAQ:AMZN) is off 46% off its July 2021 $188 all-time high, while Alphabet (NASDAQ:GOOGL) is down 22% off its August 2021 $155 all-time high. And Microsoft (NASDAQ:MSFT) remains 20% down from its November 2021 $362 spike and all-time high.
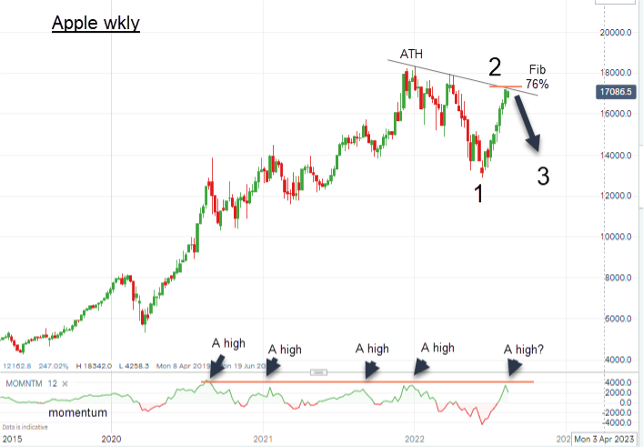
Apple has been the undoubted leader on the way up, but the others are lagging badly. This is Apple's weekly chart:
Past performance is not a guide to future performance.
Note that the surge off the June low (wave 1 low) has been near-vertical and is by far the strongest sustained rally ever – even stronger than the major rally phase following the 2020 coronavirus crash when many other shares were bullishly responding to the US Federal Reserve’s historic stimulus and ultra-low interest rates.
Another reason I believe that this is a second-wave rally in a major bear market is that the current steep rally is typical of a bullish mania that often occurs in second waves. It is typical that bullish fervour is even more pronounced at the top of second waves than it was at the all-time high, despite the share price being lower.
- 10 high-quality tech shares that might be on sale
- Allianz Tech confirms star manager exit as it reports brutal first half
- Ask ii...what are the pros and cons of investing in a US company?
But today the Federal Reserve is hiking rates aggressively, inflation is cutting standards of living drastically, and China seems to be in a perpetual state of rolling lockdowns. I fail to see how even mighty Apple products will continue to fly off the shelves into a saturated iPhone market.
Thus, I believe the bullish mania is at or near its end and taking at least some profits is advisable.
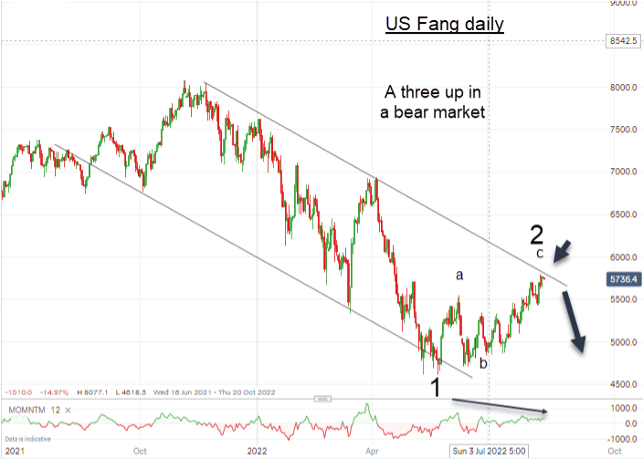
For comparison with some of the other big-name tech issues, here is the chart of the FAANG gang;
Past performance is not a guide to future performance.
The chart sports a classic tramline pair with the index just having touched the upper tramline resistance on a momentum divergence. And the rally off the low looks very much like a three so far (this is a corrective pattern to the one larger trend, which is down).
Thus, provided this market does not push strongly above current levels, I see a hard down into September, which traditionally is a negative month for shares.
With so many headwinds that may even blow stronger as we approach winter, I am making my case for taking profits in Apple (and many other tech issues).
Big money is flowing back into tech now as funds jump on this latest trend. But they are usually very poor market timers and often get in right near the end of a trend. Will history repeat?
John Burford is a freelance contributor and not a direct employee of interactive investor.
These articles are provided for information purposes only. Occasionally, an opinion about whether to buy or sell a specific investment may be provided by third parties. The content is not intended to be a personal recommendation to buy or sell any financial instrument or product, or to adopt any investment strategy as it is not provided based on an assessment of your investing knowledge and experience, your financial situation or your investment objectives. The value of your investments, and the income derived from them, may go down as well as up. You may not get back all the money that you invest. The investments referred to in this article may not be suitable for all investors, and if in doubt, an investor should seek advice from a qualified investment adviser.
Full performance can be found on the company or index summary page on the interactive investor website. Simply click on the company's or index name highlighted in the article.
Disclosure
We use a combination of fundamental and technical analysis in forming our view as to the valuation and prospects of an investment. Where relevant we have set out those particular matters we think are important in the above article, but further detail can be found here.
Please note that our article on this investment should not be considered to be a regular publication.
Details of all recommendations issued by ii during the previous 12-month period can be found here.
ii adheres to a strict code of conduct. Contributors may hold shares or have other interests in companies included in these portfolios, which could create a conflict of interests. Contributors intending to write about any financial instruments in which they have an interest are required to disclose such interest to ii and in the article itself. ii will at all times consider whether such interest impairs the objectivity of the recommendation.
In addition, individuals involved in the production of investment articles are subject to a personal account dealing restriction, which prevents them from placing a transaction in the specified instrument(s) for a period before and for five working days after such publication. This is to avoid personal interests conflicting with the interests of the recipients of those investment articles.