Chart of the week: FTSE and the GameStop saga – is there a link?
The activist Reddit investor short squeeze could mean these shares will be in the spotlight next.
1st February 2021 16:06
by John Burford from interactive investor
The activist Reddit investor short squeeze could mean these shares will be in the spotlight next.

I am sure there are few investors not following the gripping drama surrounding the GameStop (NYSE:GME) affair, which is being covered blow-by-blow by the mainstream media.
Since the news broke of the short squeezes engendered by Reddit group WallStreetBets on some minor equities that were shorted by hedge funds, the FTSE 100 has declined sharply.
So the question is this – is there any connection? After all, massive fund losses have resulted from rising share prices, so why would a stock index be hurt by these advances?
A rising share price usually is the result of a more positive sentiment towards the company – but not here. Far from it. It is the consequence of the extreme bearish stance of the funds where the short interest has gone over the top and exceeded well over 100% of the float in some cases.
But what a perfect scenario for a short squeeze – and what a squeeze!
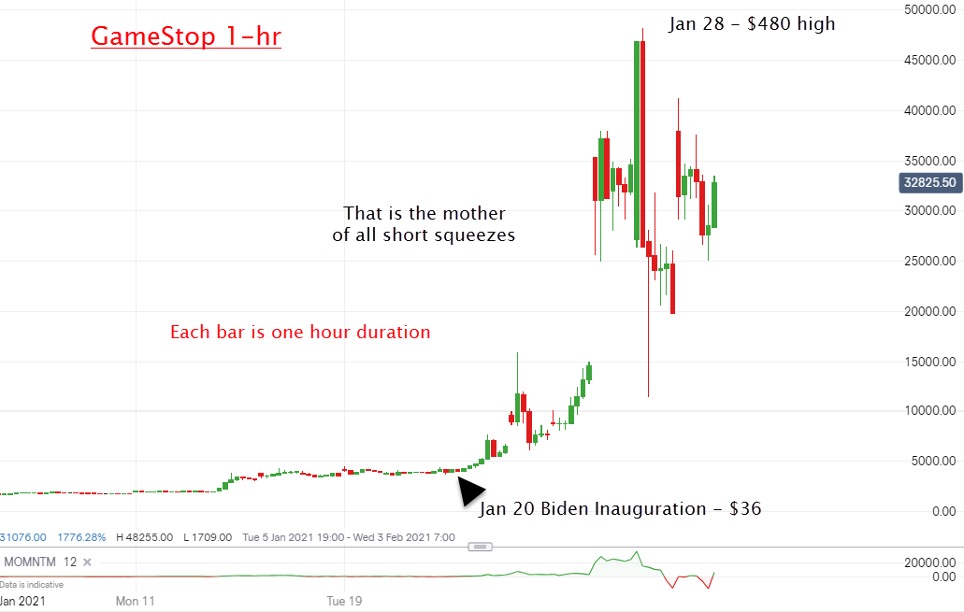
Source: interactive investor. Past performance is not a guide to future performance.
As I noted to clients last week, there will be two main trends for investors in the near-term. First, shares that have been heavily shorted will be targets for the WallStreetBets investors to run up. We are seeing that in the outperformance of a basket of most-shorted US shares.
- From bitcoin to GameStop, pandemic stress could hurt financial choices
- A risky investing craze: GameStop’s most volatile day
- Are you saving enough for retirement? Our calculator can help you find out
And in the UK, the much-depressed and heavily shorted Petrofac (LSE:PFC) shares have risen by 20% off the low point.
Second, shares that have been manically bought to extreme heights of valuation - Tesla (NASDAQ:TSLA) and the FAANG stocks (Facebook (NASDAQ:FB)Amazon (NASDAQ:AMZN), Apple (NASDAQ:AAPL), Netflix (NASDAQ:NFLX) and Google (Alphabet (NASDAQ:GOOGL)) - being the most prominent) will see strong selling pressure. That is being caused by the necessity of hedge funds to sell holdings to raise capital to cover their losses on their shorts.
Of course, the big test will come if the Federal Reserve tries to inject even more dollars into Wall Street to prevent a crash. Hmm.
But the US short squeeze ramifications are showing up in the FTSE. I have had a major upside target around the 7,000 mark for some time. It hit that target on 8 January and has fallen by 9% so far. Here is my updated chart:
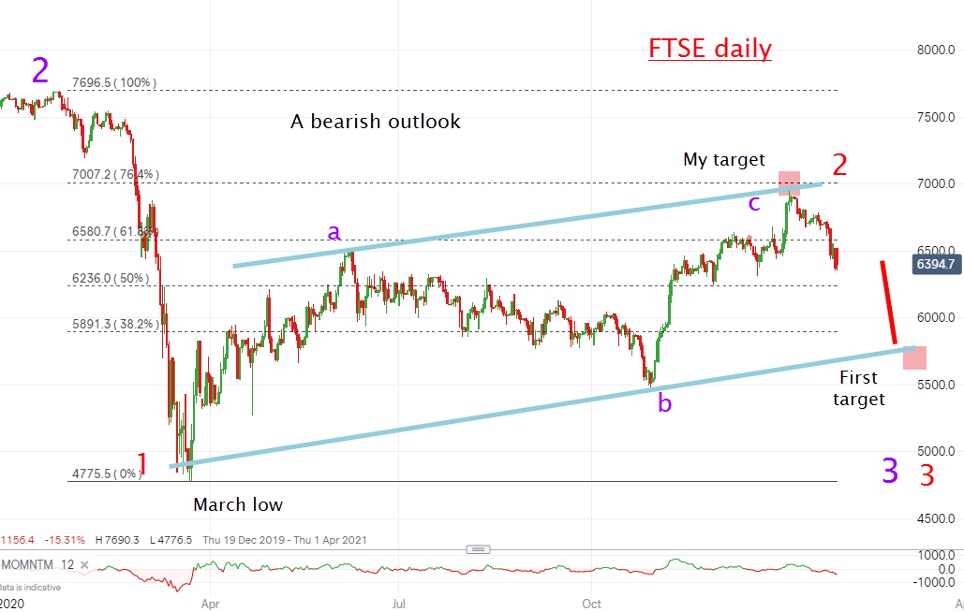
Source: interactive investor. Past performance is not a guide to future performance.
If my wave labels are correct, we are starting a sharp wave three of three lower, which is one of the strongest waves in the book. Extreme investor caution remains advised.
The big question is: will the GameStop butterfly flapping its wings in the outer reaches of the stock market about to unleash a tornado in the main indices?
John Burford is the author of the definitive text on his trading method, Tramline Trading. He is also a freelance contributor and not a direct employee of interactive investor.
These articles are provided for information purposes only. Occasionally, an opinion about whether to buy or sell a specific investment may be provided by third parties. The content is not intended to be a personal recommendation to buy or sell any financial instrument or product, or to adopt any investment strategy as it is not provided based on an assessment of your investing knowledge and experience, your financial situation or your investment objectives. The value of your investments, and the income derived from them, may go down as well as up. You may not get back all the money that you invest. The investments referred to in this article may not be suitable for all investors, and if in doubt, an investor should seek advice from a qualified investment adviser.
Full performance can be found on the company or index summary page on the interactive investor website. Simply click on the company's or index name highlighted in the article.
Disclosure
We use a combination of fundamental and technical analysis in forming our view as to the valuation and prospects of an investment. Where relevant we have set out those particular matters we think are important in the above article, but further detail can be found here.
Please note that our article on this investment should not be considered to be a regular publication.
Details of all recommendations issued by ii during the previous 12-month period can be found here.
ii adheres to a strict code of conduct. Contributors may hold shares or have other interests in companies included in these portfolios, which could create a conflict of interests. Contributors intending to write about any financial instruments in which they have an interest are required to disclose such interest to ii and in the article itself. ii will at all times consider whether such interest impairs the objectivity of the recommendation.
In addition, individuals involved in the production of investment articles are subject to a personal account dealing restriction, which prevents them from placing a transaction in the specified instrument(s) for a period before and for five working days after such publication. This is to avoid personal interests conflicting with the interests of the recipients of those investment articles.