Chart of the week: high time for marijuana stocks?
The industry could be due a rebirth in the US with incoming president Joe Biden.
11th January 2021 14:43
by John Burford from interactive investor
The industry could be due a rebirth in the US with incoming president Joe Biden.

Last decade saw the birth of the (legitimate) marijuana industry in North America. There is a historic body of evidence that this plant provides much-needed medical benefits to several debilitating human conditions. But its pharmacological introduction is being held back by the stubborn refusal by the establishment, who only see its well-publicised and sensational recreational aspects.
It is still considered the pathway to more dangerous drugs such as heroin by many. I say that attitude is the true Reefer Madness.
But with the recent change in attitude, there is a growing list of US states that have legalised the drug and it is now being medically prescribed.
- Invest with ii: Top UK Shares | Super 60 Investment Ideas | Open a Trading Account
But as usual, the sudden rush of interest at first was not met with reality and most of the ‘pot stocks’ fell back – some fell very hard. These could be presenting us with a great opportunity as ‘buy low, sell high’ candidates.
- Cannabis ETFs have winning month thanks to US election
- Thematic ETFs: what investors need to know
- Why reading charts can help you become a better investor
Here is the Cannabis Index (a list of 29 of the leading shares) since launch in 2019:
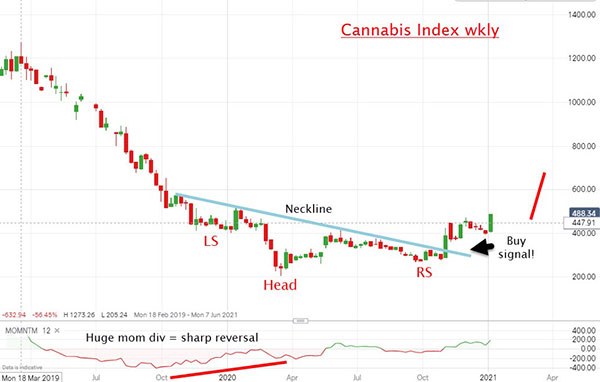
Source: interactive investor. Past performance is not a guide to future performance.
The decline has been dramatic - from the high in 2019 above 1,200, it fell to the Covid-19 crash low in March last year at the 200 area. But since then it has been forming a multi-year base, and with the first major thrust upwards in November, has formed what appears to be a solid ‘head and shoulders’ reversal pattern. The momentum divergence at the ‘head’ low is huge and signals a likely coming sharp reversal up.
Given this background, let’s look at the astonishing price chart of one of the leaders – Tilray (NASDAQ:TLRY) - which was the first pot stock to be listed on a major US exchange (Nasdaq):
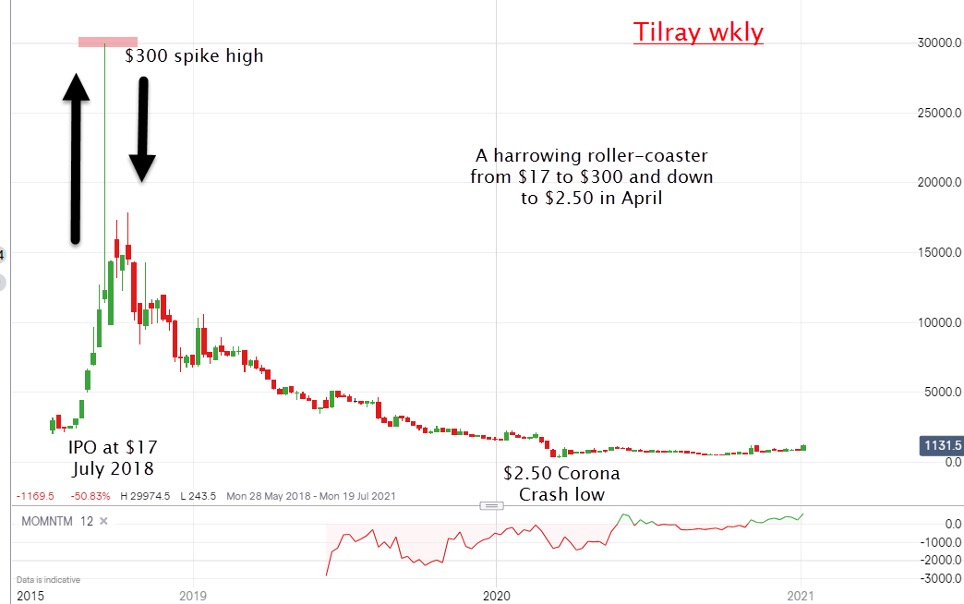
Source: interactive investor. Past performance is not a guide to future performance.
This must be the most extreme display of a roller-coaster ride of any share I have ever seen! It is safe to say that since the April low at $2.50 (£1.85), interest in this share has dropped to near-zero as most of the enthusiastic punters at the initial public offering have surely been either wiped out or have placed their share certificates swell to the back of their safe in readiness for the next time they redecorate.
But with buying interest much reduced – and short interest huge (latest data shows 22% of the float have been sold short), a short squeeze could be on the cards especially given the new Biden administration’s pledge to de-criminalise pot use at the Federal level.
- Covid vaccine rally tops your 2020 investing highlights
- Are you saving enough for retirement? Our calculator can help you find out
I consider Tilray a great candidate for my ‘buy low, sell high’ list (latest print $11).
Here is another large pot stock, Canopy Growth (NASDAQ:CGC):
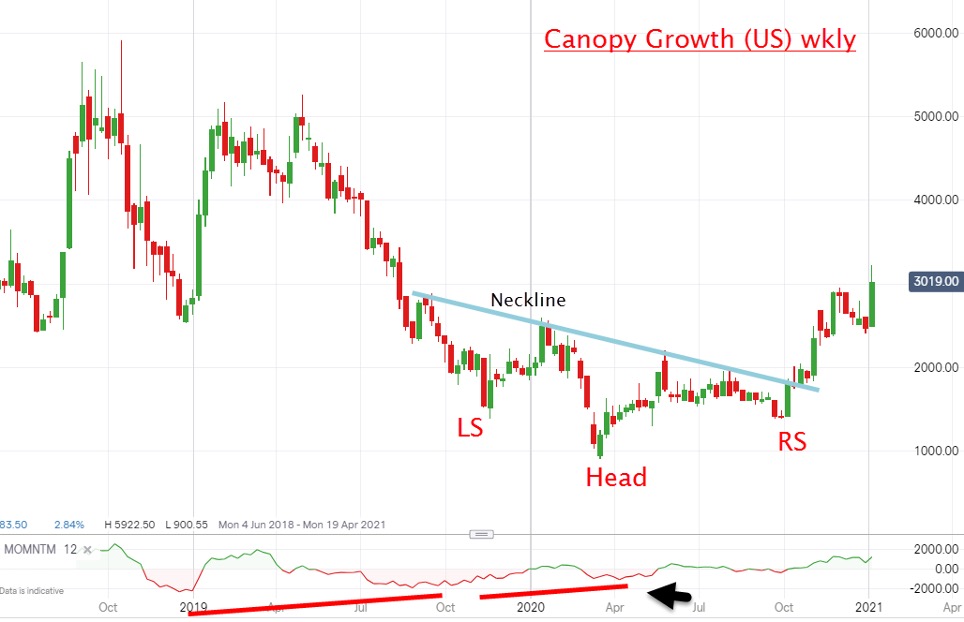
Source: interactive investor. Past performance is not a guide to future performance.
It has fared a lot better than Tilray as its financials are in much better shape. Note the same ‘head and shoulders’ reversal pattern, with a similar strong momentum divergence.
At the current $30 print, it has reached a minor price target and could pull back into the mid/low 20s in the next few days/weeks. If so, that would be an excellent buying area.
*Please note, some stocks mentioned in this video are not available for purchase on the interactive investor platform.
John Burford is the author of the definitive text on his trading method, Tramline Trading. He is also a freelance contributor and not a direct employee of interactive investor.
These articles are provided for information purposes only. Occasionally, an opinion about whether to buy or sell a specific investment may be provided by third parties. The content is not intended to be a personal recommendation to buy or sell any financial instrument or product, or to adopt any investment strategy as it is not provided based on an assessment of your investing knowledge and experience, your financial situation or your investment objectives. The value of your investments, and the income derived from them, may go down as well as up. You may not get back all the money that you invest. The investments referred to in this article may not be suitable for all investors, and if in doubt, an investor should seek advice from a qualified investment adviser.
Full performance can be found on the company or index summary page on the interactive investor website. Simply click on the company's or index name highlighted in the article.
Disclosure
We use a combination of fundamental and technical analysis in forming our view as to the valuation and prospects of an investment. Where relevant we have set out those particular matters we think are important in the above article, but further detail can be found here.
Please note that our article on this investment should not be considered to be a regular publication.
Details of all recommendations issued by ii during the previous 12-month period can be found here.
ii adheres to a strict code of conduct. Contributors may hold shares or have other interests in companies included in these portfolios, which could create a conflict of interests. Contributors intending to write about any financial instruments in which they have an interest are required to disclose such interest to ii and in the article itself. ii will at all times consider whether such interest impairs the objectivity of the recommendation.
In addition, individuals involved in the production of investment articles are subject to a personal account dealing restriction, which prevents them from placing a transaction in the specified instrument(s) for a period before and for five working days after such publication. This is to avoid personal interests conflicting with the interests of the recipients of those investment articles.