Chart of the week: is it time to bet against Tesla?
Tesla is valued higher than the top six car makers, but the tide may be turning.
2nd November 2020 11:51
by John Burford from interactive investor
Tesla is valued higher than the top six car makers combined, but our chartist argues the tide may be turning.

With last week’s sharply lower stock indices, it appears my long-standing forecast for a significant correction (at the very least) is coming to pass. In fact, odds are rapidly mounting that my long-awaited deflationary depression scenario is at hand.
I subscribe to the theory that price movements in public markets (ones relatively free from direct manipulation by very large forces) are determined by changes in social mood and sentiment that are patterned by Elliott waves.
I have shown time after time that earnings do not drive the markets, except possibly in the very near term. Since the financial crash 11 years ago, we have seen a surge in positive mood especially in the hot big-name tech issues. They have been seen as ‘never sell’ holdings since they dominate their sectors (for now).
While that can be said for the likes of Amazon (NASDAQ:AMZN), Google (NASDAQ:GOOGL) and Netflix (NASDAQ:NFLX) (but not Apple (NASDAQ:AAPL) or Facebook (NASDAQ:FB)), that is not the case for the most heavily speculated company, Tesla (NASDAQ:TSLA) (which is a top favourite of the Robinhood teenage day traders).
Goodness knows Tesla is not short of competition, as new electric vehicles are hitting showrooms almost every day.
- Is this stock the new Tesla?
- Tesla and Apple top list of bestselling stocks
- Forget Tesla, check out these alternatives
In recent weeks we have seen Tesla’s valuation exceeding the sum of six of the largest global car manufacturers, despite only selling a fraction of their output.
Hedge funds, who are not noted for missing such disparities, have been shorting the shares for months – and losing their shirts as the shares have kept advancing.
Obviously, they are not masters of timing. Their mistake was relying on logic, as markets have a logic of their own.
I have been biding my time waiting for a better time to bet against Tesla using my chart analysis tools. Here is the remarkable explosion in the share price since last year:
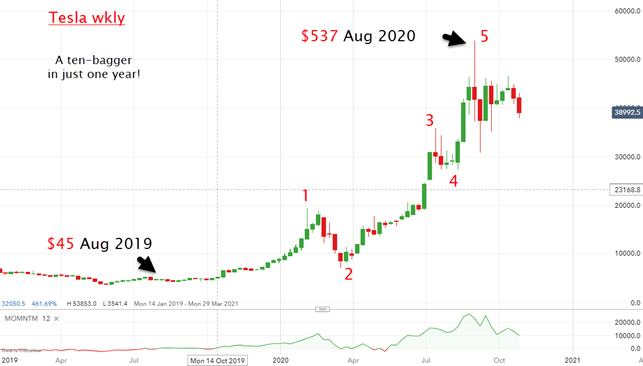
Source: interactive investor. Past performance is not a guide to future performance.
Such is the power of one single idea that has swept the globe – green energy to save the planet.
But did the August spike mark the top just as bullish sentiment reached its zenith?
- ii view: Tesla profits supercharged in Q3
- Take control of your retirement planning with our award-winning, low-cost Self-Invested Personal Pension (SIPP)
Note the candlestick there – it is a clear weekly key reversal. Following that, September and October were marked with a spike low and then a recovery as ‘investors’ bought the dip in the belief they were grabbing a bargain.
But was that rally a bull trap? Here is a close-up of recent action:
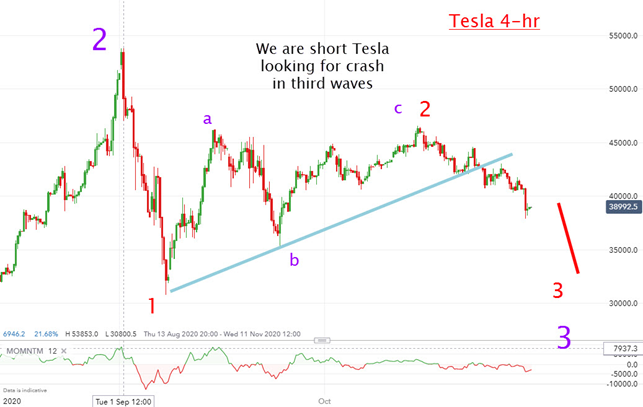
Source: interactive investor. Past performance is not a guide to future performance.
From the August wave two high, I have textbook waves. When the market broke below my blue trendline I had a sell signal, as that marked the likely start of a third wave down (third waves are usually the longest and strongest in the book).
In fact, it is a third of a third – an even more powerful wave.
With more severe pandemic lockdowns in the offing around the world, social mood is trending lower - and will drag share prices down with it.
For more information about Tramline Traders, or to take a three-week free trial, go to www.tramlinetraders.com.
John Burford is the author of the definitive text on his trading method, Tramline Trading. He is also a freelance contributor and not a direct employee of interactive investor.
These articles are provided for information purposes only. Occasionally, an opinion about whether to buy or sell a specific investment may be provided by third parties. The content is not intended to be a personal recommendation to buy or sell any financial instrument or product, or to adopt any investment strategy as it is not provided based on an assessment of your investing knowledge and experience, your financial situation or your investment objectives. The value of your investments, and the income derived from them, may go down as well as up. You may not get back all the money that you invest. The investments referred to in this article may not be suitable for all investors, and if in doubt, an investor should seek advice from a qualified investment adviser.
Full performance can be found on the company or index summary page on the interactive investor website. Simply click on the company's or index name highlighted in the article.
Disclosure
We use a combination of fundamental and technical analysis in forming our view as to the valuation and prospects of an investment. Where relevant we have set out those particular matters we think are important in the above article, but further detail can be found here.
Please note that our article on this investment should not be considered to be a regular publication.
Details of all recommendations issued by ii during the previous 12-month period can be found here.
ii adheres to a strict code of conduct. Contributors may hold shares or have other interests in companies included in these portfolios, which could create a conflict of interests. Contributors intending to write about any financial instruments in which they have an interest are required to disclose such interest to ii and in the article itself. ii will at all times consider whether such interest impairs the objectivity of the recommendation.
In addition, individuals involved in the production of investment articles are subject to a personal account dealing restriction, which prevents them from placing a transaction in the specified instrument(s) for a period before and for five working days after such publication. This is to avoid personal interests conflicting with the interests of the recipients of those investment articles.