Chart of the week: I’ve found a share worth buying in a crash
9th May 2022 14:11
by John Burford from interactive investor
With tech stocks and many market indices falling sharply, technical analyst John Burford names the share he is bullish on. Here’s why.

Last week, the US Federal Reserve (and then the Bank of England) announced that they intend to ramp up the Fed Funds interest rates rapidly and to aggressively unload larger chunks of their assets (bonds) into the open market, starting next month.
Not only that, but it is no secret that consumer price inflation that is running at 40-year highs, and is likely to go higher still, is hugely impacting consumer confidence and buying patterns.
Consumer confidence is sinking like a stone and bullish market sentiment is falling off a cliff.
With such a dire macro environment – that promises little respite – is it any wonder shares are in decline with some in free fall, especially those in the tech sector.
And what a turnaround from the high hopes of last year! Back then, the enthusiasm for most things tech – especially if they were 'disruptive and innovative' – was riding high. But what a difference an historic about-turn by the Fed in November from ‘accommodative’ to ‘hawkish’ has made.
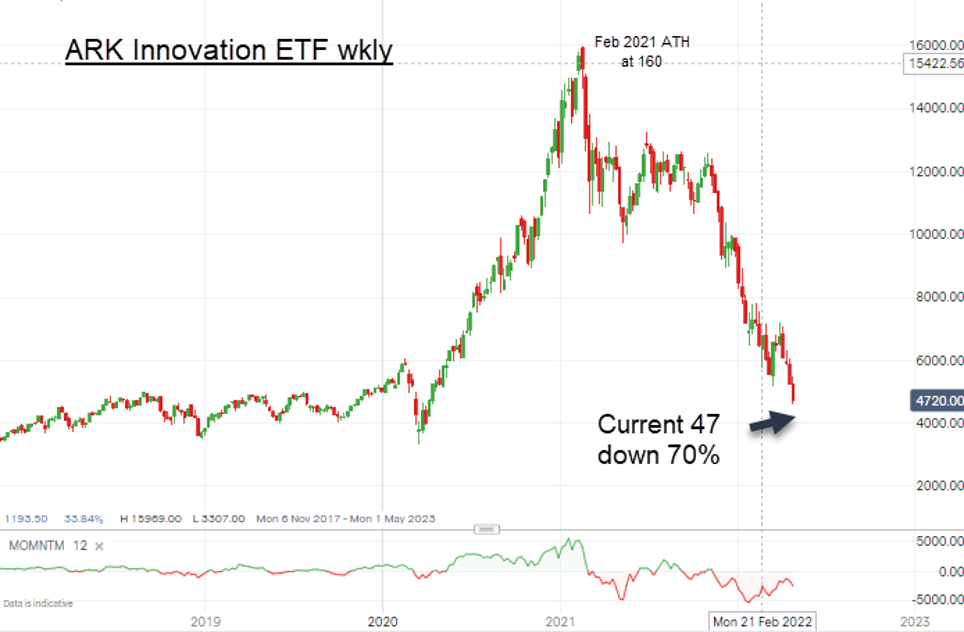
As a measure of the out-of-love investors are now feeling towards tech, here is the famous (or is that infamous?) ARK Innovation ETF run by Cathie Wood.

Past performance is not a guide to future performance.
This fund contains the shares of many electric vehicle (EV) outfits, which are being battered by investors (and hedge funds). Remember when EVs were the future?
Not any more as the major material constraints many of us proposed earlier are now being recognised more widely. For instance, the price of lithium has skyrocketed so that now a battery's raw material costs now account for 80% of its cost (it was 40% in 2015).
The race is on to develop new supplies, but they may arrive too late to save the sector as the final vehicle price would put them out of reach of more. Already, an EV costs at least three times the equivalent fossil version.
If the outlook for the economy and shares is really this bleak, what can investors do to protect themselves? Here in the UK, we are far behind the US in offering simple means to protect portfolios against major losses other than to sell holdings into cash.
While that may be wise in certain circumstances, and buying now much-cheaper bonds with a good yield may pay off, I can offer an idea that would partly hedge your UK-based portfolio.
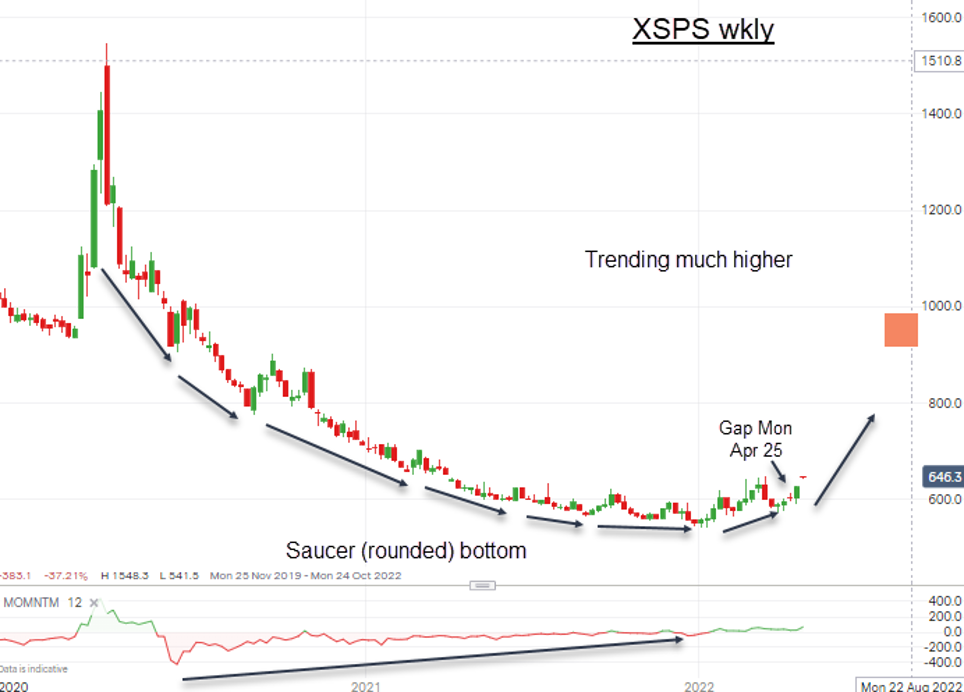
Here is the Xtrackers S&P 500 Inverse Daily Swap ETF (LSE:XSPS)

Past performance is not a guide to future performance.
This share moves inverse to the S&P 500 index (and most other global indexes). The FTSE should move in a very similar way. When the FTSE 100 declines, this share appreciates.
Note the classic ‘rounded bottom’ that turned up in January when the S&P 500 topped.
This share is quoted in US dollars and a UK investor would get the benefit of any further dollar appreciation, of course.
I am bullish on this ETF.
John Burford is a freelance contributor and not a direct employee of interactive investor.
These articles are provided for information purposes only. Occasionally, an opinion about whether to buy or sell a specific investment may be provided by third parties. The content is not intended to be a personal recommendation to buy or sell any financial instrument or product, or to adopt any investment strategy as it is not provided based on an assessment of your investing knowledge and experience, your financial situation or your investment objectives. The value of your investments, and the income derived from them, may go down as well as up. You may not get back all the money that you invest. The investments referred to in this article may not be suitable for all investors, and if in doubt, an investor should seek advice from a qualified investment adviser.
Full performance can be found on the company or index summary page on the interactive investor website. Simply click on the company's or index name highlighted in the article.
Disclosure
We use a combination of fundamental and technical analysis in forming our view as to the valuation and prospects of an investment. Where relevant we have set out those particular matters we think are important in the above article, but further detail can be found here.
Please note that our article on this investment should not be considered to be a regular publication.
Details of all recommendations issued by ii during the previous 12-month period can be found here.
ii adheres to a strict code of conduct. Contributors may hold shares or have other interests in companies included in these portfolios, which could create a conflict of interests. Contributors intending to write about any financial instruments in which they have an interest are required to disclose such interest to ii and in the article itself. ii will at all times consider whether such interest impairs the objectivity of the recommendation.
In addition, individuals involved in the production of investment articles are subject to a personal account dealing restriction, which prevents them from placing a transaction in the specified instrument(s) for a period before and for five working days after such publication. This is to avoid personal interests conflicting with the interests of the recipients of those investment articles.