Chart of the week: Netflix shares are half price – should you buy?
31st January 2022 12:18
by John Burford from interactive investor
After losing 50% of its value, technical analyst John Burford reveals whether he’s a buyer or seller of US tech stocks. The answer is illuminating.

I have been covering the FAANG Gang, and especially Apple (NASDAQ:AAPL), since my Chart of the Week of 29 November. Then, I suggested Apple was at or near its top, and that taking at least some profits was a prudent move. And that sentiment could easily have been employed in many other big name tech shares.
After all, it has been All One Market! Even no-hope assets have been rising with the Federal Reserve money tide. But a lot has happened since November.
- No trading fees on US shares until 11 February. Click here for details
- Chart of the week: tech stocks and what to make of the crash
Here is my updated chart of the US Fang Index, which has moved sharply lower off its November high, broken my major trendline and is testing my shelf of support:
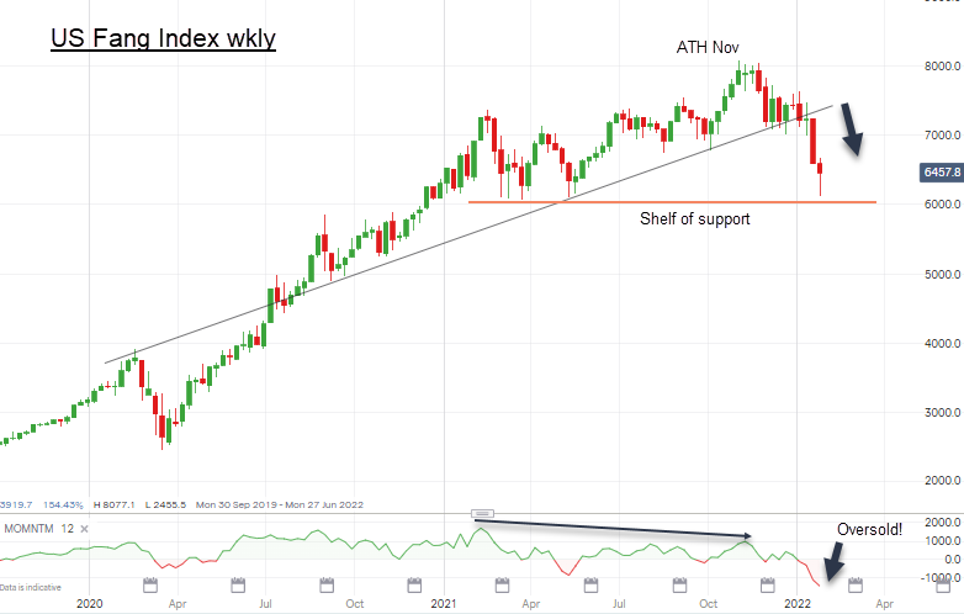
Past performance is not a guide to future performance.
In that process, the weakest member by far has been Netflix (NASDAQ:NFLX), which issued its latest Q4 earnings report earlier this month. Despite much of the data exceeding expectations – usually a trigger for another sharp leg up in the share price – the shares actually plunged. The 'excuse' offered (after the event of course) was that customer numbers were projected to fall behind the usual growth patterns.
Technicians always view these after-the-event reasons for a particular market move as pure rationalisation; the signs for a decline were already in place (as it was for Apple, previously). Any fool can come up with post-hoc stories to 'explain' a certain market move. Unless you have acted in anticipation of that move, that kind of analysis is worthless to your equity valuation!
But the scale of the Netflix pullback did astonish me. They have lost about 50% in value. It demonstrated above all that when 'never sell' shares do correct, they do it in style.
So having called the FAANG correction, will I be willing to change horses so soon after my bearish call? There is little doubt that a 50% discount on a former high-growth share such as Netflix appears very attractive – here is the chart:
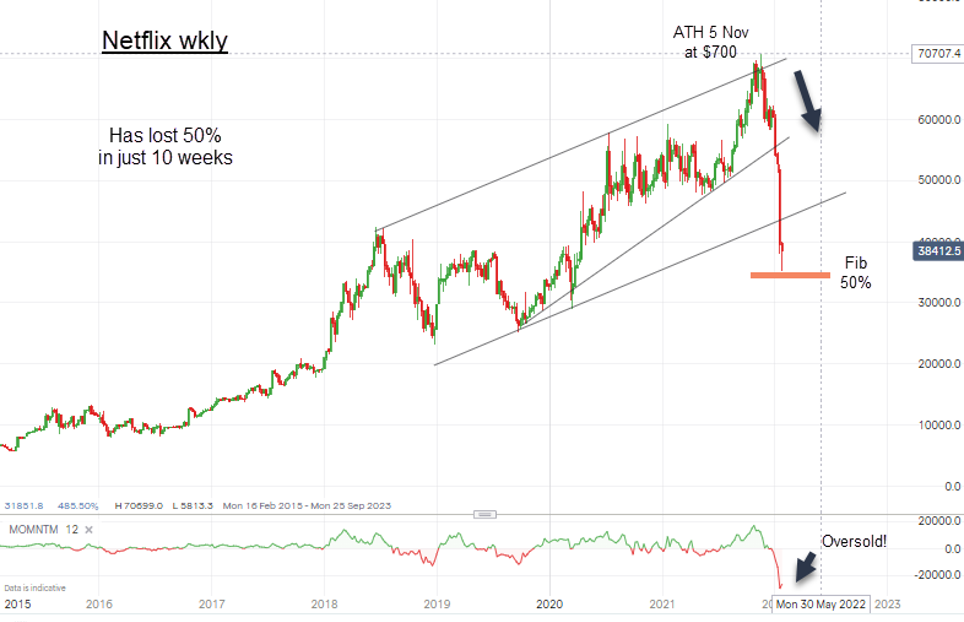
Past performance is not a guide to future performance.
I believe the plunge over just 10 weeks has attracted much short selling, especially from hedge funds. After all, it was a common perception that the US big name techs had become way overvalued, and some funds were just itching for a trigger to take a short interest.
But now at the very significant Fibonacci 50% level, I believe many funds will be covering their shorts and be joined by new 'value' investors.
One other important factor is the sudden falling in love with 'value' sectors and against 'growth'. Signs are that this switch may have trapped many investors into abandoning growth, which should now be poised to resume their bull trends – at least for now.
I am thus adding Netflix (and several other big name tech stocks) to my Buy Low/Sell High list.
John Burford is a freelance contributor and not a direct employee of interactive investor.
These articles are provided for information purposes only. Occasionally, an opinion about whether to buy or sell a specific investment may be provided by third parties. The content is not intended to be a personal recommendation to buy or sell any financial instrument or product, or to adopt any investment strategy as it is not provided based on an assessment of your investing knowledge and experience, your financial situation or your investment objectives. The value of your investments, and the income derived from them, may go down as well as up. You may not get back all the money that you invest. The investments referred to in this article may not be suitable for all investors, and if in doubt, an investor should seek advice from a qualified investment adviser.
Full performance can be found on the company or index summary page on the interactive investor website. Simply click on the company's or index name highlighted in the article.
Disclosure
We use a combination of fundamental and technical analysis in forming our view as to the valuation and prospects of an investment. Where relevant we have set out those particular matters we think are important in the above article, but further detail can be found here.
Please note that our article on this investment should not be considered to be a regular publication.
Details of all recommendations issued by ii during the previous 12-month period can be found here.
ii adheres to a strict code of conduct. Contributors may hold shares or have other interests in companies included in these portfolios, which could create a conflict of interests. Contributors intending to write about any financial instruments in which they have an interest are required to disclose such interest to ii and in the article itself. ii will at all times consider whether such interest impairs the objectivity of the recommendation.
In addition, individuals involved in the production of investment articles are subject to a personal account dealing restriction, which prevents them from placing a transaction in the specified instrument(s) for a period before and for five working days after such publication. This is to avoid personal interests conflicting with the interests of the recipients of those investment articles.