Commodities: Copper sells off this week after PMI's dampen the mood
Our market analyst gives his take on the industrial metal as well as the latest updates on oil.
3rd July 2019 11:22
by Rajan Dhall from interactive investor
Our market analyst gives his take on the industrial metal as well as the latest updates on oil.
So the trade talks in Japan at the G20 didn't go as well as planned then. Commodities rose in an initial reaction with the exception of gold as the USD and indices rallied, but after the initial upbeat tone copper came back to reality and sold off for the rest of the week.
The main issue for the industrial metal has been the prospect of weaker global demand. PMI's from around the world have been softer with UK and EU performing at very low levels and the rest of the world's results didn't set the market alight either. Back to events in Japan and a truce between the US and China was enough to hold the bears off for a while but the harsh reality is that the two economic powerhouses have just kicked the can down the road to lead to another crunch event later in our calendars.
Meanwhile, the likes of KAZ Minerals (LSE:KAZ) and Glencore (LSE:GLEN) deteriorate with both falling about 20% since April. Having a closer look at the situation, China accounts for half of all global base metal demand and the US equates to 10% and after China's factory activity dropped off in June due to domestic and export demand faltering some business surveys in China are forecasting more pain.
The technical picture for copper looks to be tilted to the downside. The trendline supporting price is looking more and more vulnerable to a break although the last time it was tested it held up well. The weekly candle close will tell us a lot about sentiment too so keep an eye on the price action at the end of the week. At the moment the $2.54/lb level seems to be the next probable target unless we get some better news on the trade front.
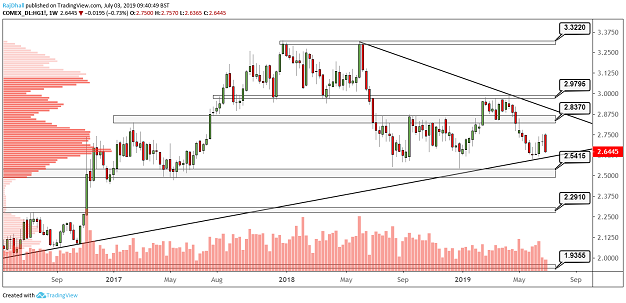
Source: TradingView Past performance is not a guide to future performance
On the oil front, it has been a mammoth week as OPEC+ agreed to extend the output cuts into 2020. After around 10 hours of meetings, it seems that after a brief issue with Iran, Saudi minister Al-Falih stated the commitment to the nine-month extension was "unequivocal." Interestingly, even though the cartel has been successful at stemming the losses Bloomberg reported that OPEC's oil market share has fallen to the lowest since 1991. Having said this yesterday oil traders sold at higher levels and WTI futures fells 4.85% after the API report showed a rise in Cushing inventory levels.
On the technical front, WTI has been working very well. The highs seen in WTI following the OPEC meeting met resistance exactly at the trendline originating mid April. The daily candle posted a doji formation and subsequently sold off in dramatic fashion. For those non (technical) believers this is when the going was good and the bulls were in complete control. Now on the downside, the major support zone kicks in at $54.36 dollars per barrel, so I will be watching the market like a hawk at that level.
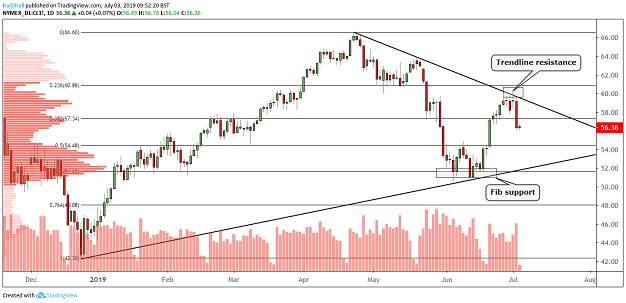
Source: TradingView Past performance is not a guide to future performance
Rajan Dhall is a freelance contributor and not a direct employee of interactive investor.
These articles are provided for information purposes only. Occasionally, an opinion about whether to buy or sell a specific investment may be provided by third parties. The content is not intended to be a personal recommendation to buy or sell any financial instrument or product, or to adopt any investment strategy as it is not provided based on an assessment of your investing knowledge and experience, your financial situation or your investment objectives. The value of your investments, and the income derived from them, may go down as well as up. You may not get back all the money that you invest. The investments referred to in this article may not be suitable for all investors, and if in doubt, an investor should seek advice from a qualified investment adviser.
Full performance can be found on the company or index summary page on the interactive investor website. Simply click on the company's or index name highlighted in the article.