Commodities outlook: Can gold price overcome resistance?
Pausing for breath after surging to six-year highs, we look at gold's potential for further upside.
15th August 2019 11:37
by Rajan Dhall from interactive investor
Pausing for breath after surging to six-year highs, we look at gold's potential for further upside.

Commodities prices are once again hanging on the whim of the political tennis match between the US and China. Last week, the US backed down and said they would delay the 10% increase till 15 December as another round of talks kick off next month. So, all is well then?
No....just today, China says it will have to take countermeasures on US moves, and it believes US action violates consensus that was reached at the G20 meeting in Osaka.
Indices took another dump and, overall, the macroeconomic environment seems as fragile as ever. Yesterday, all three major US bourses fell around 3% and gold still hangs just above the $1,500 per ounce level in its role as the ultimate safe haven.
Looking at copper, the weekly chart suggests we are in for some more downside pressure.
The long-term trendline has been broken to the downside, and faltering Chinese and German industrial growth seem to be major catalysts.
On the downside, there are a few key levels to keep an eye on. The major support zone in this current consolidation zone is at $2.50 per pound, although in nearer term maybe $2.58 is stronger. Beyond that, $2.30 per pound would be the next consolidation high and be where the market finds the next value area.
At the bottom of the chart below, I have plotted the Stochastic and MACD indicators. Currently, they are both printing a bearish picture. The stochastic is in the oversold area and the moving averages (MACD) have crossed over to the downside once again which also indicates more selling pressure.
The MACD histogram represents the difference between the moving averages used to create the indicator. The further they diverge the bigger the histogram is. At the moment it is below the mid-line and showing us a negative picture.
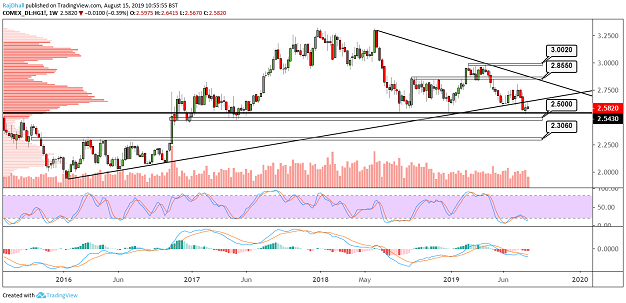
Source: TradingView Past performance is not a guide to future performance
Gold has now come up to the major resistance zone that’s been mentioned in the past few weeks. Price action has stalled, despite the major sell-off in equities and events in Hong Kong.
There is enough going on at the moment to send prices through the key resistance level, but when price action stalls like this, investors must sit up and take notice. It only needs a few comments from influential players like Trump or Chinese President Xi Jinping for the price to fall back.
Either way, long term the chart still looks bullish, but might need to retrace slightly first for some much-needed breathing space.
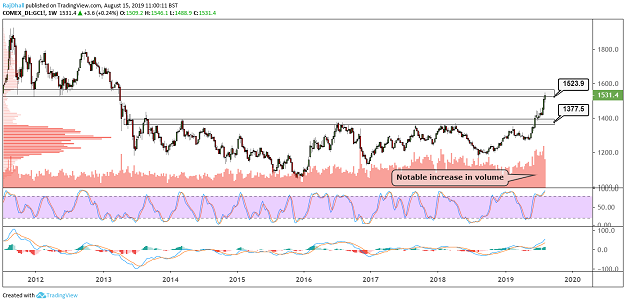
Source: TradingView Past performance is not a guide to future performance
Rajan Dhall is a freelance contributor and not a direct employee of interactive investor.
These articles are provided for information purposes only. Occasionally, an opinion about whether to buy or sell a specific investment may be provided by third parties. The content is not intended to be a personal recommendation to buy or sell any financial instrument or product, or to adopt any investment strategy as it is not provided based on an assessment of your investing knowledge and experience, your financial situation or your investment objectives. The value of your investments, and the income derived from them, may go down as well as up. You may not get back all the money that you invest. The investments referred to in this article may not be suitable for all investors, and if in doubt, an investor should seek advice from a qualified investment adviser.
Full performance can be found on the company or index summary page on the interactive investor website. Simply click on the company's or index name highlighted in the article.