Dow Jones: here are the warning signs to look out for
US indices have sunk due to virus woes. Our chartist gives his verdict on where things could go.
29th October 2020 09:24
by Alistair Strang from Trends and Targets
US indices have sunk due to virus woes. Our chartist gives his verdict on where things could go.
Wall Street (DOWi:DJI)
Monday last week was the anniversary of ‘Black Monday’ in the US, a day in 1987 when the Dow Jones managed to lose more than 25% of its value in a single session.
We even wrote an article about it, deciding not to publish as it read like panic clickbait. Some analysts had pointed out the markets were in a similar position, ready for a sharp drop.
Needless to say, markets were not in such a state, but following reversals this week we're substantially less confident calamity isn't far away.
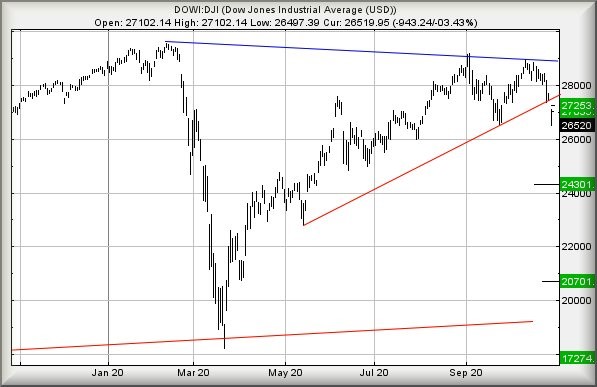
When we reviewed matters prior to the 23rd anniversary of ‘Black Monday’ the Dow was trading around 28,700 points and we calculated the US index needed to reverse below 26,500 before we'd have concerns for the future.
Alas, yesterday the Dow managed to bottom at 26,497 points. So far we're not seeing great evidence of a recoil in horror from the horrid reversal potential which just triggered (by only three points, it must be said).
The immediate situation is quite dangerous, weakness now below 26,497 risking entering a cycle to an initial 24,300 points. While this sounds dramatic, our secondary and hopeful bottom calculation comes in at 20,700 points.
The secondary ‘bottom’ number has a pretty unpleasant implication, taking the index into a zone where an ultimate wipe-out allows for an eventual 17,270 points.
As the visuals confirm, this would entirely undo all the Dow Jones gains during the current Trump presidency! It's perhaps not the ideal image to portray during a US Presidential shambles.
If this has all been a dreadful aberration, due to Covid-19 fears once again making themselves known worldwide, early signals of this being an over-reaction shall come if the US index manages to exceed 26,830 points. This would calculate with the potential of a fairly tame-sounding 27,035 points.
Achieving a rebound at this level will be the first tick box hinting bottom is ‘in’.
If bettered, our secondary calculation works out at 27,250 points and allows a deep breath. Above such a point, we shall tend to relax and run the numbers again.
It's almost Halloween. Perhaps the market is just giving the world a bit of a fright... Or should we anticipate ‘Halloween Market Massacre’ headlines?
Source: Trends and Targets Past performance is not a guide to future performance
Alistair Strang has led high-profile and "top secret" software projects since the late 1970s and won the original John Logie Baird Award for inventors and innovators. After the financial crash, he wanted to know "how it worked" with a view to mimicking existing trading formulas and predicting what was coming next. His results speak for themselves as he continually refines the methodology.
Alistair Strang is a freelance contributor and not a direct employee of Interactive Investor. All correspondence is with Alistair Strang, who for these purposes is deemed a third-party supplier. Buying, selling and investing in shares is not without risk. Market and company movement will affect your performance and you may get back less than you invest. Neither Alistair Strang or Interactive Investor will be responsible for any losses that may be incurred as a result of following a trading idea.
These articles are provided for information purposes only. Occasionally, an opinion about whether to buy or sell a specific investment may be provided by third parties. The content is not intended to be a personal recommendation to buy or sell any financial instrument or product, or to adopt any investment strategy as it is not provided based on an assessment of your investing knowledge and experience, your financial situation or your investment objectives. The value of your investments, and the income derived from them, may go down as well as up. You may not get back all the money that you invest. The investments referred to in this article may not be suitable for all investors, and if in doubt, an investor should seek advice from a qualified investment adviser.
Full performance can be found on the company or index summary page on the interactive investor website. Simply click on the company's or index name highlighted in the article.