FTSE 100: A history lesson that could help predict the future
29th October 2018 08:49
by Alistair Strang from Trends and Targets
After learning much from the 2009 crash, chartist Alistair Strang tells us where the FTSE 100 should bounce. He also examines whether retail bank struggler Barclays could be heading for 78p.

Barclays, The FTSE, and The 2009 Crash
As a headline, we probably ticked all three best clickbait terms, only excluding Brexit for justified hysterics. Spoiler Alert; we're about to mention a potential bottom at 78p for Barclays and the FTSE 100 at 3,935.
Except we've a few issues with what's being going on. The drops being experienced do not "feel" right!
Our story starts in 2008 on May 20th. Around 11am - from memory - the FTSE achieved a logical target level, causing us to monitor it closely for the next jump signal. At mid-day, the next jump triggered but 13 minutes later, the FTSE abruptly reversed for absolutely no arithmetic reason. It was as if someone decided, "that was a mistake, we need to reverse this..."
As it our nature, a trend line was drawn from the extremely odd high points across this 13-minute period, a trend line which was to accurately define the drop from 6,470 to 3,450 points during the next nine months.
Make no mistake, we bitched repeatedly about this absurd 13-minute trend as it implied market control at levels usually only witnessed in the Silver exchange. (Which is why we do not bother with silver.)
This time around, we've not isolated any such control over the trend. Instead, things just keep going down, thankfully our arithmetic logic remaining intact. As Friday's FTSE performance tended prove, software remains in charge.
For quite a while, it appeared our initial drop target of 6,878 was going to prove bottom with the index bouncing convincingly once the 6,878 thing was achieved. Even though at 10:32am, the drop target was broken for a few seconds.
Alas, this break was to prove prophetic as the day progressed. Despite the bounce, next time 6,878 broke at 3:30pm, the index slumped further. Even worse, despite yet another bounce, the session ended below our "Gates of Hell are 6,955" level. The FTSE closing the week at 6,939 points.
Despite the FTSE not yet closing below its low of March this year, we're now looking at travel below 6,850 bringing 6,635 initially with secondary around 5,900 points.
But what's missing this time around are visual signs of market manipulation and as a result, we're not convinced. It's usually the case, when software logic forces a market movement, any indication of human intervention is easily (to us) visible.
While it sounds a bit 'conspiracy theory' paranoid, there are far too many instances where it becomes obvious when manual control intrudes. Essentially, it's not just manipulation gaps which control prices.
For now, if what's being witnessed are software generated movements, the market should eventually bounce at 6,635 points. (or so...) If it fails to do so, the high 5,000's are the best hope. Bottom is at 3,935 otherwise.
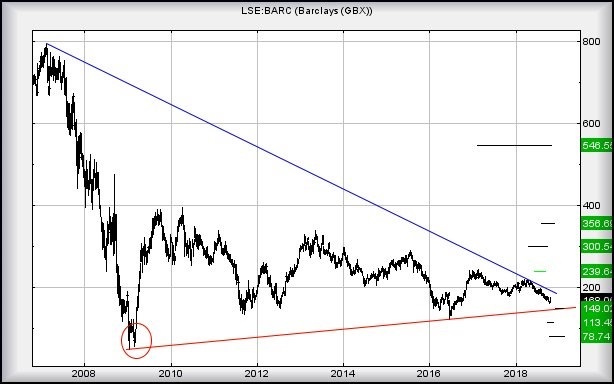
Barclays (LSE:BARC)
Despite our scary number in the headline above, there's a scent of rat about price movements. Don't get us wrong, they stink and with the share presently trading at 168p, it has become pretty easy to suggest weakness now below 166p shall provoke a drop to 158p next, another short lived bounce, then a drop down to 149p.
The red line on the chart gives some considerable hope for a serious bounce around the 149p level. It closely matches the uptrend since March 2009 through the Brexit drop of 2016. In addition, should it occur in concert with our FTSE 6,635 points reversal, further excuse is given toward a future bounce.
Obviously there is a problem if 149p is broken, even intraday. Such an event creates a scenario with 113p providing a potential bottom. Visually it matches a historic series of lows and therefore will give the market a perception of a so called support level, something we call a Glass Floor.
Glass breaks.
Below 113p is 78p, almost matching the lows of 2009.
Absolutely nothing suggests 78p as a viable drop target presently. If we rely on arithmetic, 149p should serve to provide a bottom for the share price.
One other aspect of Barclays is worthy of mention. The blue downtrend from 2007 is currently at 192p. If a miracle occurs and the price betters such a level, hold onto your socks as it's going up.
Source: Trends and Targets Past performance is not a guide to future performance
Alistair Strang has led high-profile and "top secret" software projects since the late 1970s and won the original John Logie Baird Award for inventors and innovators. After the financial crash, he wanted to know "how it worked" with a view to mimicking existing trading formulas and predicting what was coming next. His results speak for themselves as he continually refines the methodology.
Alistair Strang is a freelance contributor and not a direct employee of Interactive Investor. All correspondence is with Alistair Strang, who for these purposes is deemed a third-party supplier. Buying, selling and investing in shares is not without risk. Market and company movement will affect your performance and you may get back less than you invest. Neither Alistair Strang or Interactive Investor will be responsible for any losses that may be incurred as a result of following a trading idea.
These articles are provided for information purposes only. Occasionally, an opinion about whether to buy or sell a specific investment may be provided by third parties. The content is not intended to be a personal recommendation to buy or sell any financial instrument or product, or to adopt any investment strategy as it is not provided based on an assessment of your investing knowledge and experience, your financial situation or your investment objectives. The value of your investments, and the income derived from them, may go down as well as up. You may not get back all the money that you invest. The investments referred to in this article may not be suitable for all investors, and if in doubt, an investor should seek advice from a qualified investment adviser.
Full performance can be found on the company or index summary page on the interactive investor website. Simply click on the company's or index name highlighted in the article.