How to forecast returns without lying to yourself
It’s easy to fall for past performance when setting return expectations. But markets don't reward backward-looking investors for long.
8th August 2025 09:09
by Stéphane Renevier from Finimize
Past performance is a lousy predictor of future returns. When an asset crushes it for a decade, it often sets the stage for disappointing returns in the next, as inflated valuations inevitably fall back to earth
CAEY (cyclically adjusted earnings yield) is a better starting point for forecasting: it provides a more objective, valuation-based estimate of future returns
Right now, CAEY is flashing a big signal: non-US stocks are far more attractive than US ones. That doesn’t mean you should dump your US holdings, but it does suggest you might want to dial them down and tilt towards markets with better return potential for the next decade.
Our brains love shortcuts. When we see an asset that’s been crushing it for years, we instinctively expect more of the same. It feels safe, familiar, and, frankly, we hate the idea of missing out.
That’s why past returns have a massive influence on how we set expectations – even if we don’t realize it. We anchor to recent performance, assume the good times will go on forever, and justify it with stories about growth and innovation.
But here’s the reality: what works over short windows (momentum) often flips over the long run. Over 10 years, returns and earnings growth tend to mean-revert. The higher valuations get, the lower your future returns. So let me explain why rearview mirror investing is a dangerous habit – and how to break it.
Here’s how rearview mirrors can crash your portfolio
Here’s a stat that’ll blow your mind: over 10-year stretches, a run of strong returns and booming earnings stop being useful as a signal – and actually become dangerous. The better an asset performs over one decade, the worse its returns tend to be in the next. Same goes for earnings growth: the hottest streaks often trigger the coldest comedowns. It’s an average, sure, but it’s one of the most surprising (and important) patterns in investing.
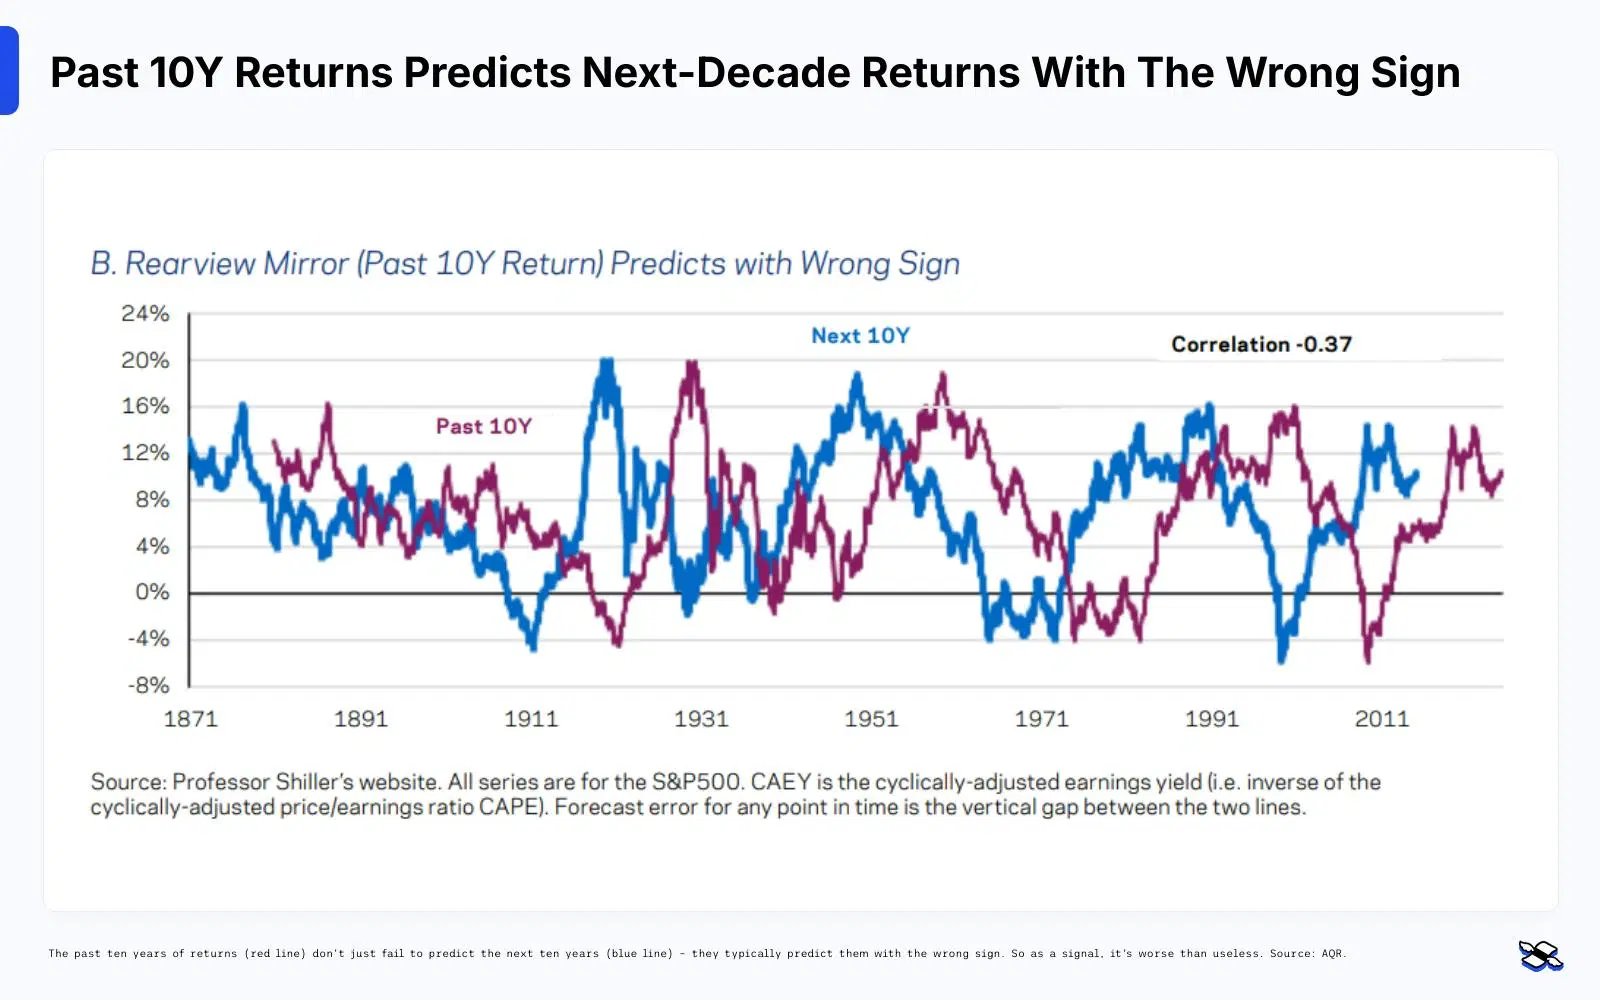
The past 10 years of returns (red line) don’t just fail to predict the next 10 years (blue line) – they typically predict them with the wrong sign. So as a signal, it’s worse than useless. Source: AQR.
The reason for this mostly comes down to valuations mean-reverting – or returning to their more-typical levels. Over a decade, it’s generally shifts in valuations (not earnings growth, as some believe) that explain most of the big swings in returns. Global investment firm AQR has even calculated that over 10-year periods, changes in valuations are 93% correlated to changes in returns, while earnings growth is just 38%.
And those valuation changes tend to be driven by our own emotions and behavioral biases. We get carried away, extrapolate recent growth way into the future, and push prices too high. But eventually, reality kicks in, and we’re left watching a painful reset.
So, it’s helpful to have an objective way of setting your expectations
At its core, forecasting long-term returns usually comes down to a simple formula:
Expected Return = Dividend Yield + Earnings Growth + Changes in Valuations
That’s the framework I used in a deep dive forecasting the S&P 500’s returns over the next 10 years. I broke down each driver, looked at historical data, layered on qualitative judgement, and built the outlook. It’s a transparent, comprehensive, and flexible approach – you can see exactly where every piece of the return comes from.
That said, it does take a lot of time and effort, and the forecasts are only as good as its assumptions. Plus, let’s face it, no one consistently gets those assumptions right.
So sometimes you want a simpler, more objective starting point – one that can be applied to any asset, without a lot of forecast work.
And for that, I like the cyclically adjusted earnings yield (CAEY). It’s basically the inverse of the cyclically adjusted price-to-earnings ratio (CAPE). While CAPE tells you how many times you’re paying for a stock’s earnings, CAEY flips things around to show you the earnings yield you’re getting, averaging profits over 10 years and adjusting for inflation to smooth out the noise.
Check out where it sits right now: the CAPE is at 38 (near a record high), while the CAEY is at 2.6% (that’s 1 divided by 38). Now, if you assume companies will reinvest their profits at the market’s cost of capital, then that 2.6% becomes your estimate of future returns. (And sadly, 2.6% is not great).
The appeal of CAEY is that it bundles together a lot of messy forecasting assumptions. For example:
- You’re not trying to predict future earnings growth – it assumes profits get reinvested at normal market rates.
- You’re not betting on where valuations will go – today’s price is already baked into the yield.
- And by smoothing earnings over a decade, you reduce the noise from cyclical profit swings.
- So it really reflects the returns investors require, assuming growth remains constant and valuations stay where they are today.
Of course, CAEY isn’t perfect: it assumes profits are reinvested at average market returns, valuations can’t expand or mean-revert, and payout policies don’t change. And though its 10-year earnings average smooths noise, it can lag structural shifts.
You can build more complex models to fix some of those issues, sure. But in practice, CAEY gets you most of the way there. It’s simple, it makes sense, and – as Occam’s razor would tell you – when a straightforward model works, there’s no reason to overcomplicate it.
Here’s why this beats the rearview mirror approach
CAEY has a correlation of 0.52 to future returns – so it tends to move in the same direction of future returns, although not in perfect lockstep with them. But it offers a much better starting point than relying on past returns (negative correlation of -0.37) and past earnings growth (negative correlation of -0.21). Historically, it’s proved even more useful than knowing the next 10 years of real earnings growth in advance.
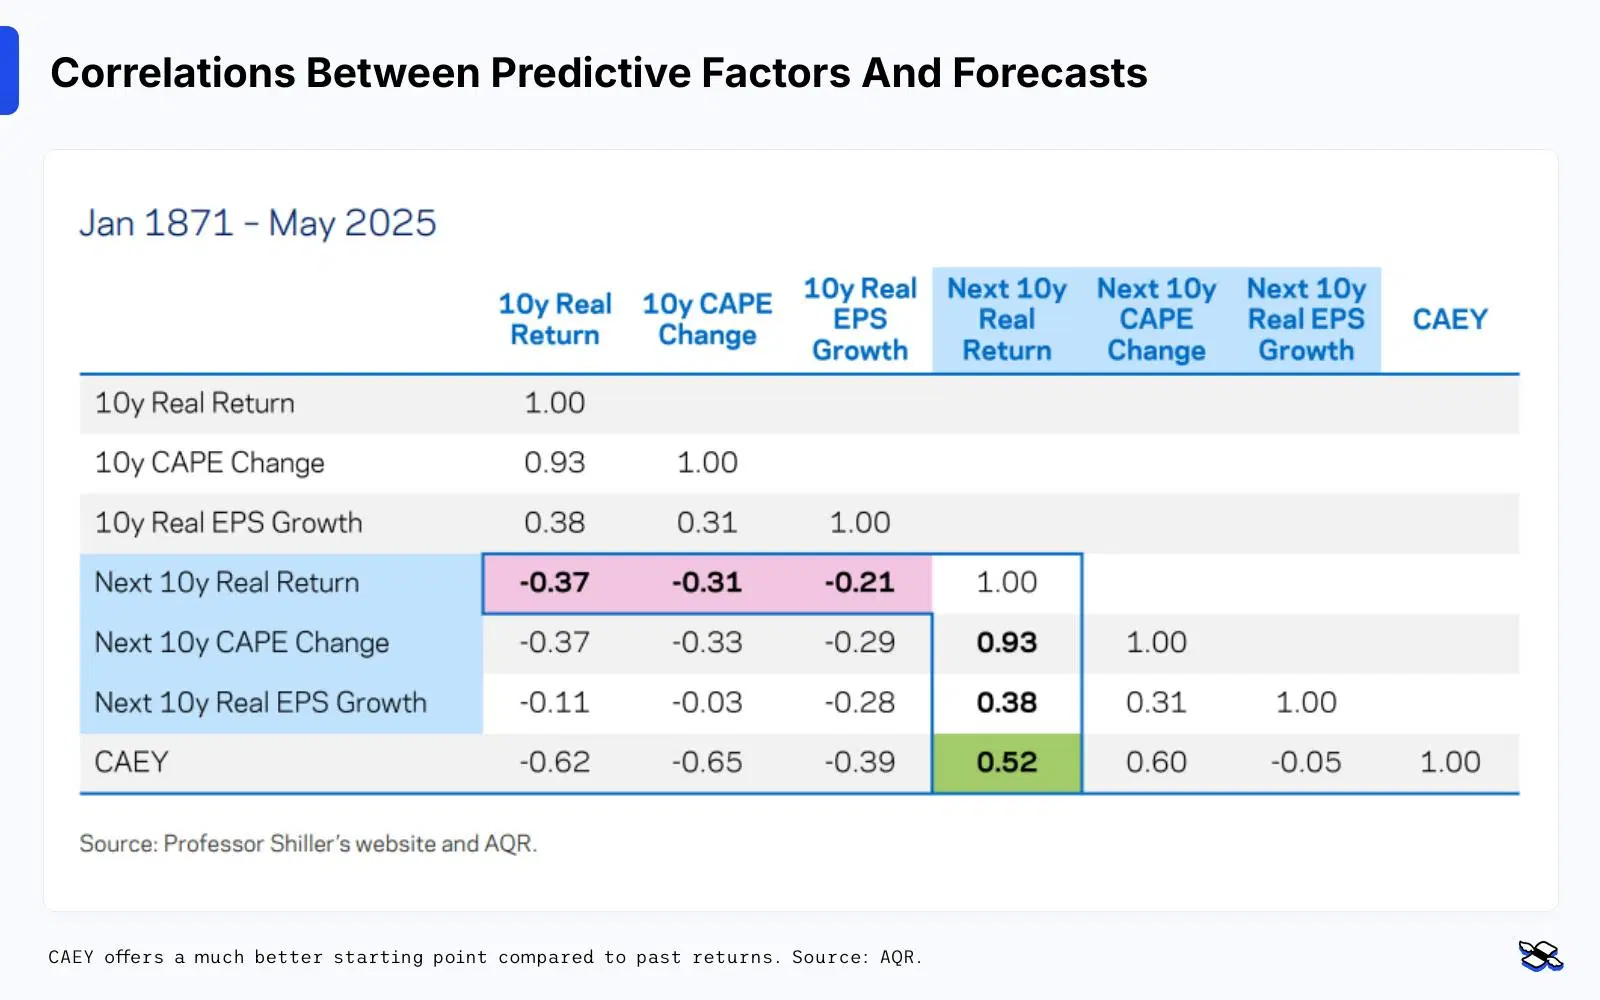
CAEY offers a much better starting point compared to past returns. Source: AQR.
The chart below shows this pretty clearly: CAEY does a far better job at forecasting future returns than any rearview mirror guesswork (just go back and check out the first chart). You can see how much more in sync this is with what actually happens next.
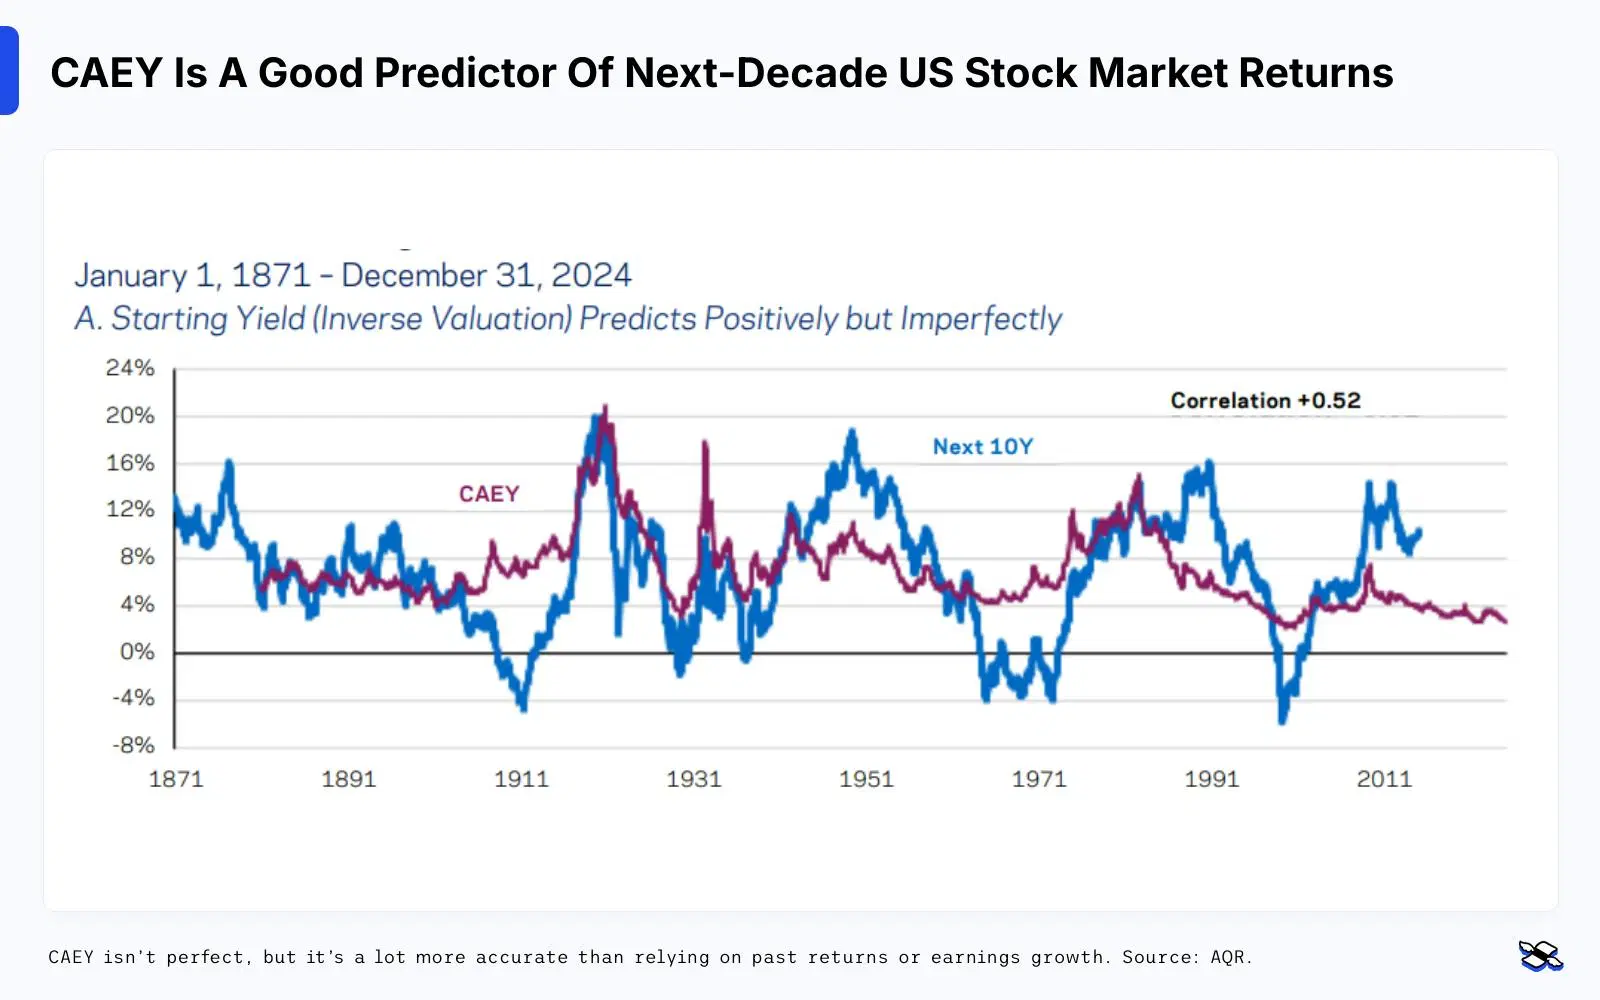
CAEY isn’t perfect, but it’s a lot more accurate than relying on past returns or earnings growth. Source: AQR.
Now, does this mean you should put all your in trust CAEY? Absolutely not.
It’s got some real limitations:
- Forecast errors are big: 3.5% per year on average, and up to 10% in extreme cases
- It has missed the mark during the past decade, failing to predict the strong returns that followed high valuations. (Though historically when this has happened, returns eventually were brought down to reality)
- And there are very few truly independent 10-year observations out there – and that makes it tricky to be totally confident in the stats.
So yes, CAEY is a better starting point than rearview mirror investing – but it’s not infallible. So take it as a useful guide, not gospel.
Finally, here’s what to make of it all
Let’s start with what the numbers are saying right now: US stocks are flashing low return expectations – around 3% per year over the next decade – while international stocks are signaling nearly double that.
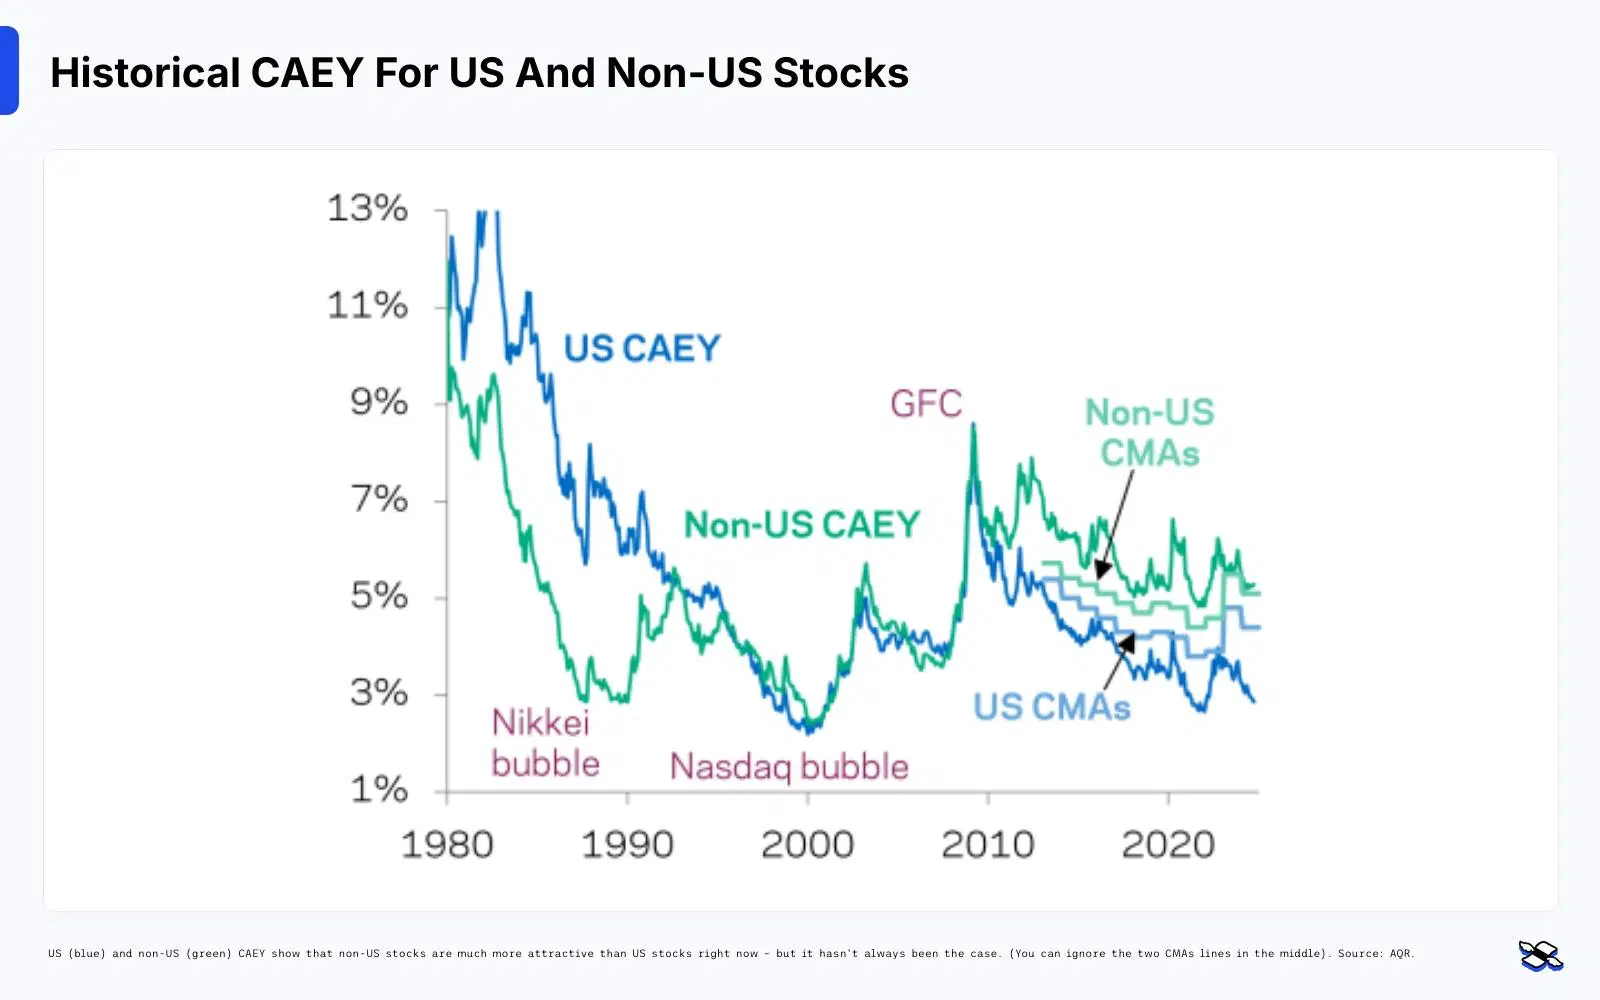
US (blue) and non-US (green) CAEY show that non-US stocks are much more attractive than US stocks right now – but it hasn’t always been the case. (You can ignore the two CMAs lines in the middle). Source: AQR.
And finally, let’s put this knowledge to good use. Here’s what that means:
First, don’t base your investment decisions on past performance alone. It’s fine to have a strong view, but you should always crosscheck it against an objective forecast like CAEY. If valuations suggest low future returns, your conviction should clear a higher bar. Corrections happen time and time again – and if you think this time will be different, you’ll need a good reason for that.
Second, pay attention when subjective hype and objective reality drift apart. History shows that when investors get overly optimistic (as they did in 2000 and 2021) and forecasts stay low, that’s a warning sign. On the flip side, when the two align (as they did in 2009), it can be a great buying opportunity. Right now, we’re edging back into warning territory.
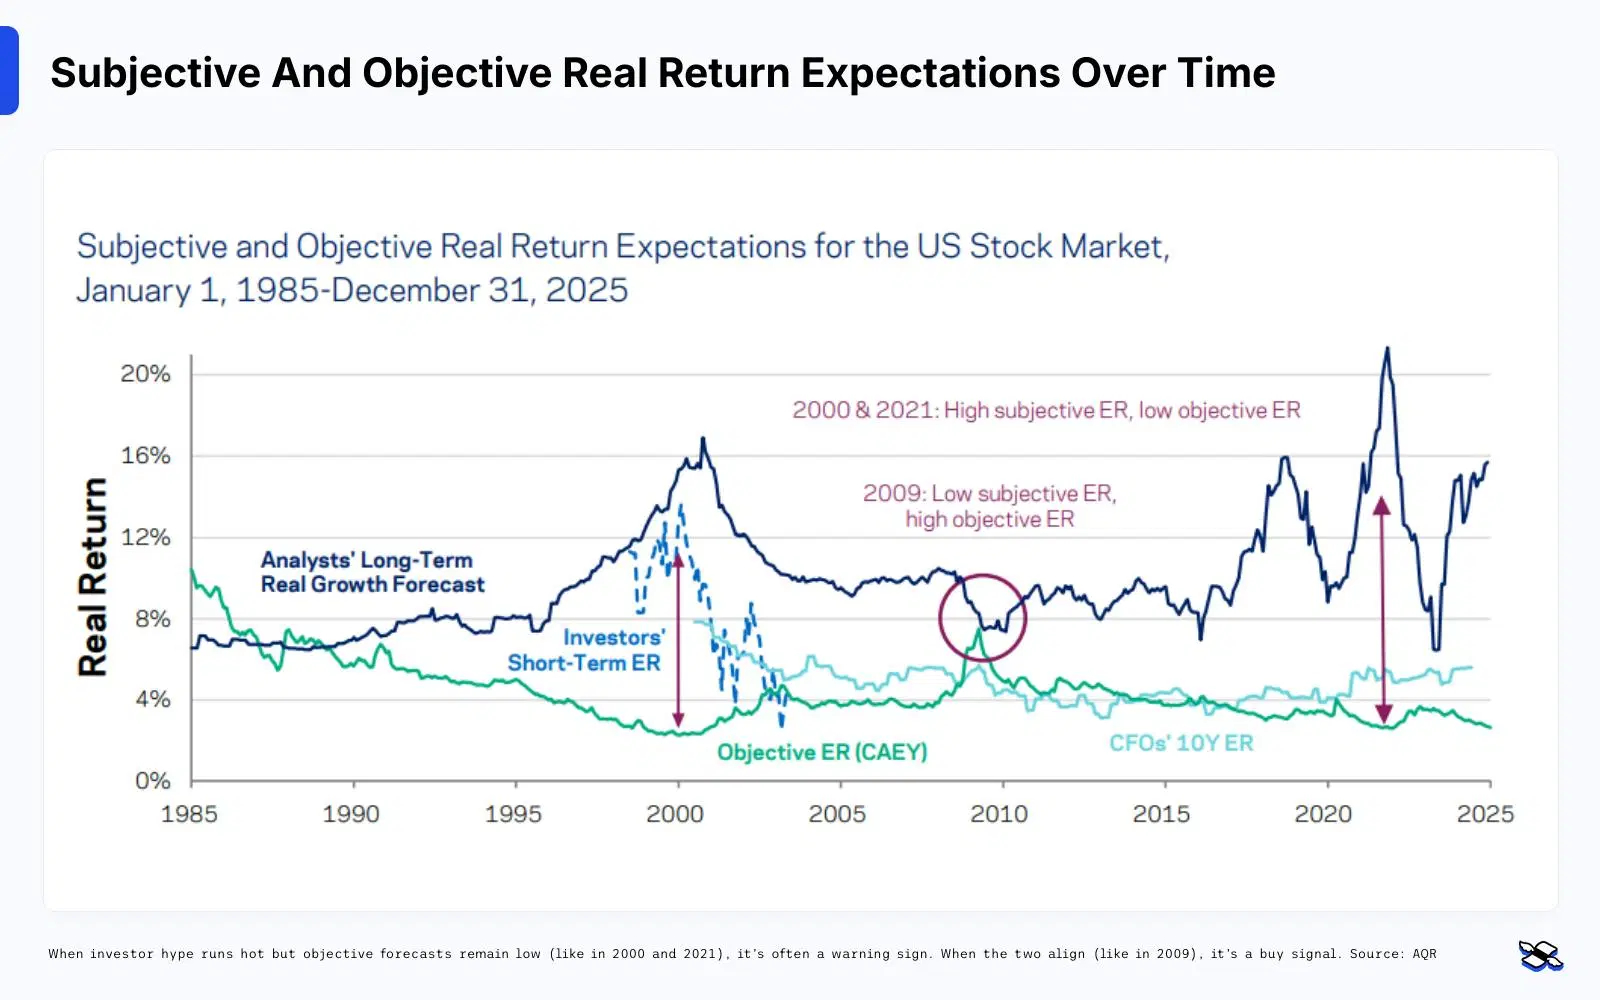
When investor hype runs hot but objective forecasts remain low (like in 2000 and 2021), it’s often a warning sign. When the two align (like in 2009), it’s a buy signal. Source: AQR
Third, don’t swing to extremes. You shouldn’t blindly trust your gut, but you shouldn’t blindly follow objective forecasts either. It’s smarter to tweak your allocations – overweight or underweight – rather than go all-in or all-out. Right now, that means keeping some exposure to US stocks, but making sure it’s balanced with markets offering higher return potential, like international stocks.
Stéphane Renevier is an analyst at finimize.
ii and finimize are both part of Aberdeen.
finimize is a newsletter, app and community providing investing insights for individual investors.
Aberdeen is a global investment company that helps customers plan, save and invest for their future.
These articles are provided for information purposes only. Occasionally, an opinion about whether to buy or sell a specific investment may be provided by third parties. The content is not intended to be a personal recommendation to buy or sell any financial instrument or product, or to adopt any investment strategy as it is not provided based on an assessment of your investing knowledge and experience, your financial situation or your investment objectives. The value of your investments, and the income derived from them, may go down as well as up. You may not get back all the money that you invest. The investments referred to in this article may not be suitable for all investors, and if in doubt, an investor should seek advice from a qualified investment adviser.
Full performance can be found on the company or index summary page on the interactive investor website. Simply click on the company's or index name highlighted in the article.