ii investment performance review: Q1 2024
The prospect of rate cuts in 2024 remained a hot topic through Q1 as inflation slowed significantly in many economies.
12th April 2024 12:17

Global equities made a solid start and returned 9.2% in the first quarter of 2024. Global bonds in contrast fell 1.2% over the same period as investors revised rate cut expectations to later in the year as the quarter went on, which weighed on bonds. Equities, however, seemed to have shrugged this off due to the ongoing enthusiasm surrounding artificial intelligence (AI) and resilient economic data coming out of the US, which saw it grow more than expected in Q4 2023.
- Invest with ii: SIPP Account | Stocks & Shares ISA | See all Investment Accounts
In the UK, the economy contracted by 0.3% in Q4 and entered a technical recession as the pent-up demand from the pandemic came to an end, with interest rates and inflation weighing on the economy. Meanwhile, Europe narrowly avoided a recession in the second half of 2023 as GDP growth for Q4 was 0% with suggestions of improving business activity.
The prospect of rate cuts in 2024 was a hot topic towards the end of 2023 with inflation across numerous economies on a downtrend. Markets were initially anticipating six to seven Fed rate cuts in 2024, however, investors tempered their expectations down to three rate cuts this year, with chair Jerome Powell signalling that the Federal Reserve will be careful on when to cut rates as the latest inflation figure of 3.2% is still above target. Similar messages have been echoed by the Bank of England (BoE) and the European Central Bank (ECB).
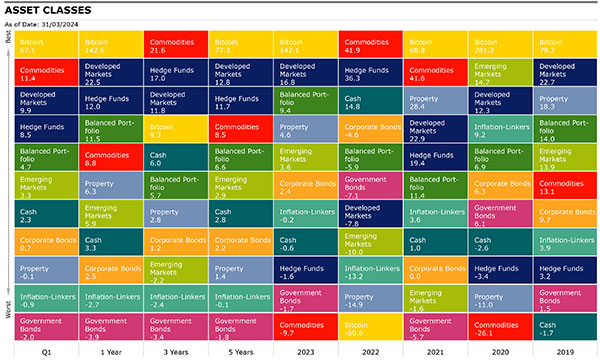
Source: Morningstar as of 31 March 2024. Total Returns in GBP. Developed Markets: MSCI World, Emerging Markets: MSCI EM, Corporate Bonds: Bloomberg Global Aggregate Corporate, Commodities: S&P GSCI, Property: FTSE EPRA Nareit Developed, Inflation-Linkers: Bloomberg Global Inflation Linked, Government Bonds: Bloomberg Global Treasury, Bitcoin: MarketVector Bitcoin, Hedge Funds: Morningstar Broad Hedge Fund, Balanced Portfolio: FTSE UK Private Investor Balanced, Cash: ICE LIBOR 1 Month.
Shares
In Q1, global equities rose 9.2% as measured by the MSCI ACWI, with developed markets outperforming emerging markets as they rose 9.9% and 3.3% respectively.
UK equities underperformed relatively as they rose 3.6% over the quarter with industrials (10.3%), healthcare (6.4%) and consumer discretionary (5.4%) leading the way, while the largest detractors were basic materials (-5.8%), utilities (-3.8%) and telecoms (-0.9%). The main drivers of UK underperformance can be attributed to poor performance of the UK economy and the market’s value style bias.
US equities returned 11.6%, buoyed by a resilient economy, strong corporate earnings and AI-related stocks as the leading contributors were communication services (16.8%), IT (13.7%) and energy (14.4%). No sectors saw negative returns in sterling terms with the worst relative underperformers being real estate (0.1%), utilities (5.2%) and consumer discretionary (5.9%).
- Sign up to our free newsletter for share, fund and trust ideas, and the latest news and analysis
- Wild’s Winter Portfolios 2023-24: up 25% with one month to go
European equities rose 6.8% in the period, boosted by better-than-expected corporate earnings as the economy narrowly avoided a technical recession. IT (16.5%) was the best-performing sector as it benefited from the AI theme, followed by consumer discretionary (12.4%) and financials (11.1%), while laggards included real estate (-14.9%), utilities (-6.9%) and consumer staples (-4.3%).
In Japan, the Topix outperformed global equities as it rose 11.1% in Q1, with the leading sectors being automotives (27.4%), financials ex banks (24.7%) and energy (21.4%), while laggards were transportation and logistics (-3.4%), foods (0.8%) and raw materials (2.4%). Japanese equities were boosted by foreign inflows amid increasing optimism over Japan’s economic upswing as mild inflation and wage growth continued from the prior year. Markets were further boosted by better-than-expected corporate earnings driven by a weak yen and an increase in short-term rates, demonstrating the central banks confidence in Japan’s economic conditions.
Emerging market equities rose 3.3%, driven by Taiwan (13.5%) as it continues to benefit from the AI tailwind, while India also contributed (7%). Despite a rebound in February, China saw negative returns (-1.3%) this quarter as investors remain cautious on the economic outlook for the Chinese economy despite fiscal stimulus. Brazil (-6.5%) was also a significant laggard in emerging markets as it suffered from tempering rate cut expectations by the Fed.
| Q1 (%) | 1 year | 3 years | 5 years | |
| FTSE All Share | 3.57 | 8.43 | 8.05 | 5.44 |
| FTSE 100 | 3.99 | 8.38 | 9.86 | 5.70 |
| FTSE 250 | 1.59 | 8.69 | 0.20 | 3.50 |
| FTSE Small Cap | 0.16 | 8.28 | 1.23 | 6.38 |
| Europe Ex UK | 6.83 | 12.65 | 8.87 | 9.58 |
| S&P 500 | 11.57 | 27.13 | 14.82 | 15.77 |
| Asia Pacific Ex Japan | 3.02 | 3.04 | -2.26 | 3.47 |
| TOPIX Japan | 11.06 | 21.65 | 6.74 | 8.16 |
| Emerging Markets | 3.30 | 5.86 | -2.22 | 2.86 |
| Brazil | -6.51 | 24.26 | 12.03 | 2.49 |
| China | -1.30 | -18.81 | -16.50 | -5.75 |
| India | 7.04 | 33.92 | 15.66 | 12.24 |
| World | 9.88 | 22.45 | 11.84 | 12.77 |
| MSCI ACWI | 9.19 | 20.60 | 10.15 | 11.61 |
| World Growth | 10.50 | 25.49 | 9.92 | 14.27 |
| World Value | 7.83 | 15.50 | 9.85 | 8.31 |
Source: Morningstar as of 31 March 2024. Total Returns in GBP. MSCI ACWI World Indexes.
Sectors/Style
Overall, global growth (10.5%) outperformed global value (7.8%) in Q1 with the notable exception being Japan where value (14.9%) outpaced growth (9.3%). At the global level, all sectors saw positive returns with, perhaps unsurprisingly, IT (13.1%) and communication services (12.4%) given their exposure to AI and semiconductors leading the charge with energy (10.4%), financials (10.3%) and industrials (10.1%) also seeing double-digit returns. Although positive, utilities (2.4%), materials (2.9%) and consumer staples (3.6%) were the notable laggards this quarter.
In terms of size, global large-cap stocks saw better returns (9.6%) than their mid and small-cap counterparts, which rose 6.8% and 4.9% respectively.
| Q1 (%) | 1 year | 3 years | 5 years | |
| Consumer Discretionary | 6.87 | 17.22 | 2.79 | 10.09 |
| Healthcare | 8.03 | 10.42 | 9.97 | 10.48 |
| Industrials | 10.08 | 21.92 | 10.89 | 11.35 |
| Information Technology | 13.08 | 37.54 | 16.82 | 22.50 |
| Materials | 2.82 | 6.18 | 5.98 | 9.35 |
| Utilities | 2.41 | 0.46 | 5.12 | 4.85 |
| Consumer Staples | 3.59 | -0.38 | 6.34 | 5.88 |
| Financials | 10.28 | 25.43 | 11.54 | 9.86 |
| Energy | 10.40 | 15.99 | 24.49 | 8.65 |
| Communication Services | 12.41 | 28.19 | 3.83 | 9.35 |
Source: Morningstar as of 31 March 2024. Total Returns in GBP. MSCI ACWI World Indexes.
Fixed Income
The Bloomberg Global Aggregate Index fell 1.2% over the first quarter as investors anticipated quicker rate cuts by central banks, as the ECB, Fed and Bank of England instead opted to remain on the cautious side, holding rates at current levels to ensure inflation is well and truly contained. Rate-cut expectations have been pushed back to later in the year. The notable exception was Japan as the country had experienced a welcomed return of modest inflation after decades of little to no growth, with the Bank of Japan finally taking the decision to increase rates from -0.1% to 0.1% for the first time in almost two decades amid growing confidence in the changes to Japan’s economic conditions.
- Bond Watch: the gilt attracting more cash than any other investment
- Everything you need to know about investing in gilts
Global corporate bonds returned 0.7% in the quarter outpacing treasuries which fell 2% over the period. High yield (3.1%) also outperformed its investment grade counterparts. In the UK, gilts and index-linked gilts fell 1.6% and 1.8%, respectively, while sterling corporates were largely flat (0.1%) over the quarter.
US 10-year yields rose from 3.9% to 4.2% over the quarter while 2-year yields rose from 4.3% to 4.6%. In the UK, 10-year yields increased from 3.5% to 3.9%, while 2-year yields increased from 4% to 4.2% in Q1.
| Q1 (%) | 1 year | 3 years | 5 years | |
| Global Aggregate | -1.19 | -1.64 | -1.89 | -0.55 |
| Global Government | -2 | -3.94 | -3.41 | -1.75 |
| UK Gilts | -1.62 | -0.04 | -7.38 | -3.77 |
| Global Corporate | 0.71 | 2.47 | 1.20 | 2.25 |
| Sterling Corporate | 0.05 | 6.15 | -3.31 | -0.34 |
| EURO Corporate | -0.97 | 3.88 | -2.30 | -0.66 |
| Global Inflation Linked | -0.90 | -2.69 | -2.41 | -0.14 |
| UK Inflation Linked | -2.05 | -5.42 | -10.51 | -5.57 |
| Global High Yield | 3.06 | 10.51 | 4.22 | 3.71 |
Source: Morningstar as of 31 March 2024. Total Returns in GBP. Global Aggregate: Bloomberg Global Aggregate, Global Government: Bloomberg Global Treasury, UK Gilts: FTSE Act UK Conventional Gilts All Stocks. Global Corporate: Bloomberg Global Corporate, Sterling Corporate: ICE BofA Sterling Non-Gilt, Euro Corporate: Markit iBoxx EUR, Global High Yield: Bloomberg Global High Yield, Global Inflation Linked: Bloomberg Global Inflation Linked, UK Inflation Linked: Bloomberg Global Inflation Linked UK.
Commodities and Alternatives
The S&P Goldman Sachs Commodities Index (GSCI) rose 11.4% as all components closed the quarter with positive returns, with energy (16.8%) and livestock (11.6%) leading the way, while agriculture (1.8%) and industrial metals (1.2%) weighed on the index despite the modest positive return.
Within energy, all components rose except for natural gas, which fell 20.6%, attributed to lower demand in Europe due to warmer than expected weather and high storage over Q1.
Despite agriculture achieving only modest gains this quarter, cocoa (149.6 %) was a notable commodity in the sector as its price skyrocketed due to shortages in West Africa, which produces more than half the world’s cocoa, as harvests have been hampered by adverse weather conditions driven by El Nino.
| Q1 (%) | 1 year | 3 years | 5 years | |
| Global REITs | -0.14 | 6.26 | 2.78 | 1.37 |
| UK REITs | -2.41 | 9.50 | -2.76 | -1.31 |
| Gold | 7.99 | 9.17 | 12.67 | 12.01 |
| Global Infrastructure | 2.27 | 1.91 | 8.62 | 5.52 |
| Global Natural Resources | 3.10 | 3.48 | 12.78 | 9.73 |
| Hedge Funds | 8.47 | 11.97 | 16.98 | 11.74 |
| Volatility | 5.45 | -31.90 | -9.86 | -0.43 |
| Cash | 2.31 | 3.35 | 5.98 | 2.82 |
| Commodity | 11.37 | 8.79 | 21.57 | 8.50 |
| Brent Crude Oil | 13.96 | 6.59 | 14.84 | 5.84 |
| Energy | 16.76 | 17.55 | 31.13 | 7.59 |
| Bitcoin | 67.06 | 142.63 | 9.27 | 77.30 |
Source: Morningstar as of 31 March 2024. Total Returns in GBP. Global REITS: FTSE EPRA Nareit Developed, UK REITs: FTSE EPRA Nareit UK, Gold: LBMA Gold Price AM, Oil: Oil Price Brent Crude, Global Infrastructure: S&P Global Infrastructure, Natural Resources: S&P Global Natural Resources, Commodities: S&P GSCI , Energy : S&P GSCI, Hedge Funds: Morningstar Broad Hedge Fund, Volatility: CBOE Market Volatility (VIX), Cash: ICE LIBOR 1 Month, Bitcoin: MarketVector Bitcoin
Most-traded shares on the ii platform in Q1 2024
Most-bought shares
| Helium One Global Ltd Ordinary Shares (LSE:HE1) |
| NVIDIA Corp (NASDAQ:NVDA) |
| Lloyds Banking Group (LSE:LLOY) |
| Tesla Inc (NASDAQ:TSLA) |
| Rolls-Royce Holdings (LSE:RR.) |
Most-sold shares
These articles are provided for information purposes only. Occasionally, an opinion about whether to buy or sell a specific investment may be provided by third parties. The content is not intended to be a personal recommendation to buy or sell any financial instrument or product, or to adopt any investment strategy as it is not provided based on an assessment of your investing knowledge and experience, your financial situation or your investment objectives. The value of your investments, and the income derived from them, may go down as well as up. You may not get back all the money that you invest. The investments referred to in this article may not be suitable for all investors, and if in doubt, an investor should seek advice from a qualified investment adviser.
Full performance can be found on the company or index summary page on the interactive investor website. Simply click on the company's or index name highlighted in the article.