ii investment performance review: Q3 2023
The third quarter saw a continuation in the slowdown in China, while the US and UK central banks hit pause on interest rates rise as inflation cooled.
12th October 2023 13:00

Market round-up
In dollar terms, global equities and bonds fell over Q3, giving up some gains made in the first half of 2023. However, in sterling terms returns were marginally positive at 0.62% and 0.43% for global equities and bonds respectively. The third quarter also saw a continuation of the economic slowdown in China, as its struggling real estate sector took to the forefront once again.
- Our Services: SIPP Account | Stocks & Shares ISA | See all Investment Accounts
Country Garden, China’s largest private property developer missed payments on its international bonds, and Zhongzhi, a Chinese wealth manager whose largest exposure is to real estate, also missed payments on its products. These events and concerns about the potential spread into the Chinese financial system have largely overshadowed the country’s continued year-on-year declines in imports and exports, which will have implications for global growth.
Economic indicators continue to paint a murky picture in the US, the UK, and Europe as the composite PMI (Purchasing Managers’ Index) has declined in these regions, with UK and Europe composite PMIs signalling a contraction and the US only just within expansion territory. The decline can mainly be attributed to the services PMI, which fell into contraction territory over Q3 in the UK and Europe; with manufacturing PMIs signalling contraction throughout 2023 so far in all three regions.
Inflation continues to dominate the market narrative with many regions seeing declines since June. In the UK, the latest inflation figure at 6.7% represented a 1.2% decline from June as core inflation also fell, albeit to a lesser extent from 6.9% to 6.2%. In Europe, headline inflation fell from 5.5% to 4.3% as core inflation also fell from 5.5% to 4.5%.
- Merryn Somerset Webb: a commodities supercycle like never before
- Portfolio diversification in action: see how it really works
In the US, the picture is slightly different as the latest inflation figure of 3.7% is a slight uptick from the 3.0% figure in June, but is still on an overall downward trajectory. In contrast, core inflation fell to 4.3% from 4.8%. With inflation generally on a downward trend, the Federal Reserve (Fed) and the Bank of England (BoE) have recently hit pause in their respective monetary tightening programmes, but have given indications of a “higher for longer” interest rate environment, quashing any hopes of rate cuts in the near term.
Note: all returns are quoted on a sterling basis, unless otherwise stated.
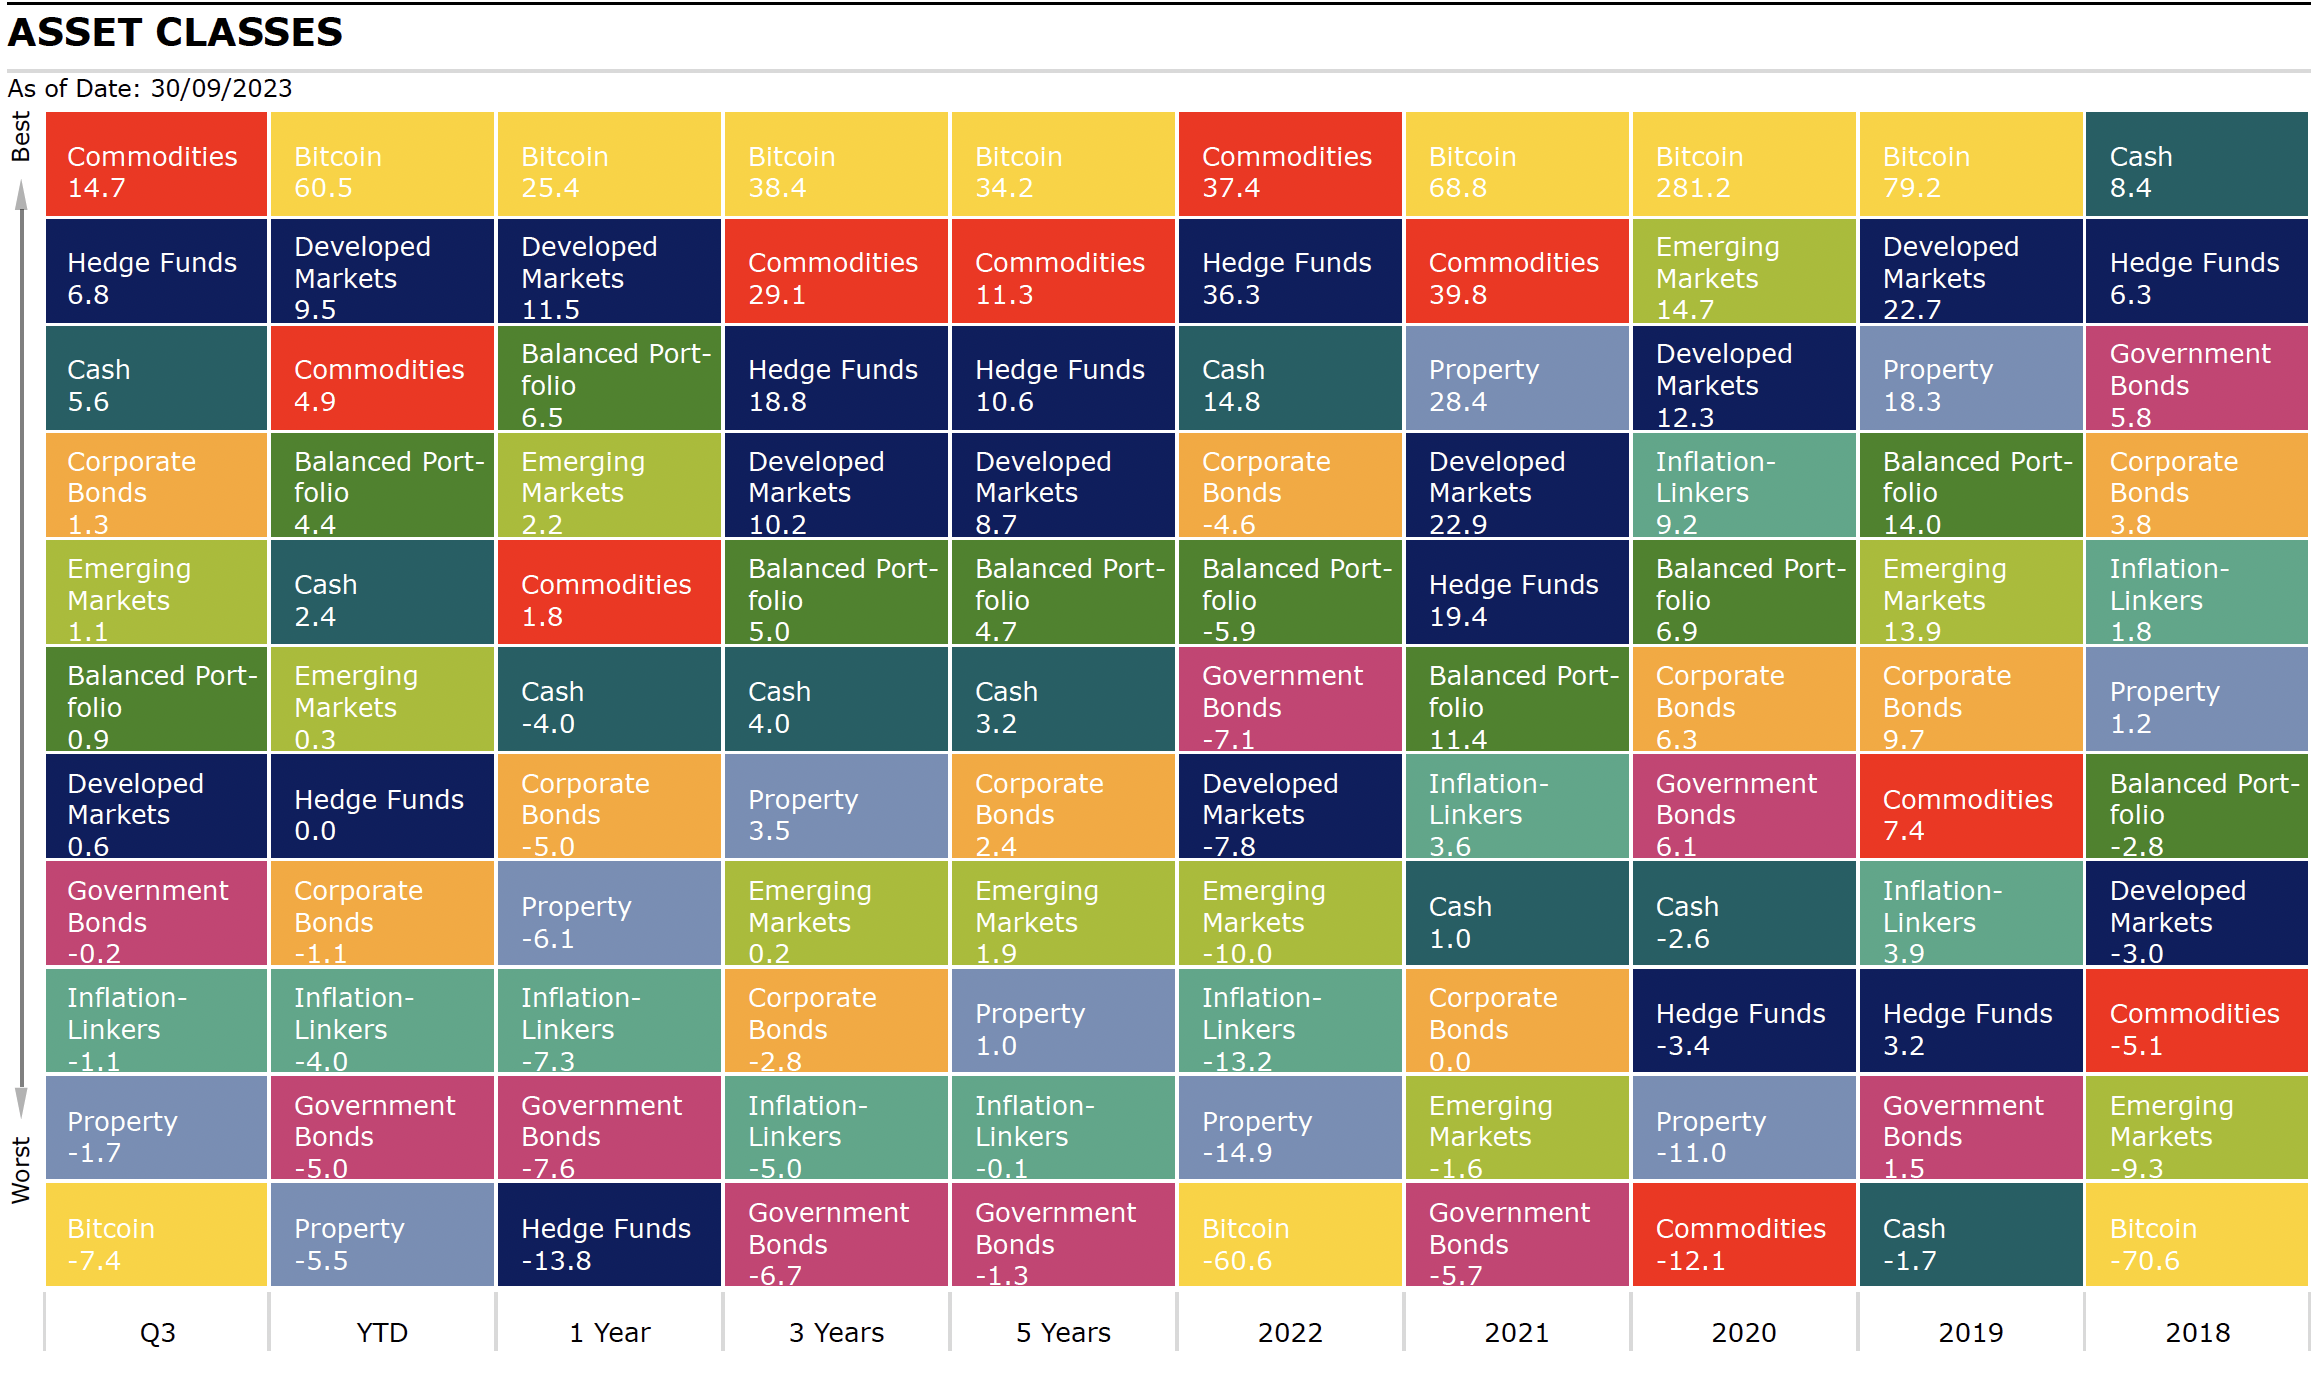
Source: Morningstar as of 30 September 2023. Total Returns in GBP. Developed Markets: MSCI World, Emerging Markets: MSCI EM, Corporate Bonds: Bloomberg Global Aggregate Corporate, Commodities: TReuters/CoreCommodity, Property: FTSE EPRA Nareit Developed, Inflation-Linkers: Bloomberg Global Inflation Linked, Government Bonds: Bloomberg Global Treasury, Bitcoin: MarketVector Bitcoin, Hedge Funds: Morningstar Broad Hedge Fund, Balanced Portfolio: FTSE UK Private Investor Balanced, Cash: ICE LIBOR 1 Month.
Equities
In Q3, global equities, as measured by the MSCI ACWI Index, returned 0.62% in sterling terms with Emerging Markets (EM) returning 1.11% and outperforming their Developed Markets (DM) counterparts.
UK equities rose 1.88% over the quarter with the largest contributing sectors being Energy (13.98%), Basic Materials (5.57%) and Tech (4.76%). Energy and Basic Materials rebounded after a lacklustre Q2, with Energy benefiting greatly from a sharp rise in oil prices as Saudi Arabia and Russia extended cuts to their supplies until the end of the year. The largest detractors were Utilities (-4.23%), Consumer Staples (-2.79%) and Consumer Discretionary (-1.42%).
In the US, the S&P 500 rose 0.75% in Q3 (but declined by 3.27% in dollar terms) with investors optimistic that the end to the Fed’s monetary tightening programme was in sight. However, this optimism faded through the quarter as “higher for longer” interest rates became more apparent. The best-performing sectors were Energy (16.61%), Communication Services (7.29%) and Financials (2.84%), while the worst performers were Utilities (-5.74%), Real Estate (-5.35%) and Consumer Staples (-2.25%).
The MSCI Europe ex-UK fell 2.03% over Q3 due to concerns over the negative impact of interest rate rises on economic growth as inflation in the eurozone slowed to a two-year low in September. Notable detractors were the Consumer Discretionary (-11.29%) and IT (-9.70%) sectors, with the best-performing sectors being Energy (18.83%), Financials (4.43%) and Healthcare (2.83%). Monetary tightening continues to plague the IT and Consumer Discretionary sectors due to the impact of interest rates on the disposable income of consumers, which can ultimately feed into the demand for computer chips. Financials outperformed as they continue to benefit from a rising interest rate environment.
- The four FTSE 100 income stars returning big money in October
- The Income Investor: don’t underestimate the value of dividend growth
Emerging Markets returned 1.11% over the quarter (-2.93% in dollar terms), ahead of global equities and Developed Markets (DMs). There are renewed concerns with regards to China’s economic slowdown and the health of its real estate sector in addition to the strength of the US economy, which could keep rates higher for longer.
Chile (-6.0%) and Poland (-9.02%) were among the worst-performing countries in EM with Chile impacted by falling lithium prices, while political theatrics in the lead up to Poland’s general election in October warded off investors. Turkey (38.23%) was among the best-performing countries in EM, as two rate rises in the quarter were viewed positively as a sign that its central bank is adopting a more orthodox approach to monetary policy.
| Q3 | YTD | 1 year | 3 years | 5 years | |
| India | 6.99 | 6.40 | 0.70 | 17.16 | 11.30 |
| TOPIX Japan | 3.36 | 9.54 | 15.14 | 4.81 | 3.28 |
| World Value | 2.21 | 0.55 | 7.06 | 12.55 | 5.82 |
| FTSE 100 | 2.19 | 5.50 | 14.66 | 13.20 | 4.17 |
| China | 2.14 | -8.63 | -3.75 | -12.61 | -2.88 |
| FTSE All Share | 1.88 | 4.54 | 13.84 | 11.81 | 3.66 |
| Emerging Markets | 1.11 | 0.35 | 2.16 | 0.18 | 1.89 |
| FTSE Small Cap | 1.02 | 0.39 | 7.48 | 9.86 | 4.03 |
| S&P 500 | 0.75 | 11.43 | 11.23 | 12.28 | 11.38 |
| Asia Pacific Ex Japan | 0.65 | -1.89 | 2.07 | 0.22 | 2.53 |
| MSCI ACWI | 0.62 | 8.47 | 10.48 | 8.96 | 7.88 |
| World | 0.56 | 9.50 | 11.54 | 10.17 | 8.69 |
| Brazil | 0.38 | 10.97 | 5.40 | 15.49 | 5.64 |
| FTSE 250 | 0.10 | -0.50 | 10.00 | 4.52 | 0.49 |
| World Growth | -0.94 | 19.12 | 15.76 | 7.32 | 10.88 |
| Europe Ex UK | -2.03 | 6.76 | 18.99 | 7.86 | 5.73 |
Source: Morningstar as of 30 September 2023. Total Returns in GBP. MSCI World Indexes.
Sectors/Style
Global value (2.21%) outperformed global growth (-0.94%) in Q3 and, while several regions including the UK, Europe, Japan and EM followed this trend, in the US growth outperformed value as Communication Services stocks led the way for growth.
At the global level, large-caps led the way having returned 0.67% for the quarter followed by small-caps (0.61%) and mid-caps (0.33%), although there were some regional differences. In Europe mid-caps outperformed large and small-cap peers, while in Japan and EM, small-caps outperformed.
As suggested in the previous section, Energy was the leading contributor to global equity performance in the quarter having risen 15.88% on account of rapidly rising oil prices throughout Q3. Communications (5.73%) and Financials (3.42%) also contributed positively to returns. The largest detractors were Utilities (-5.47%), Real Estate (-3.27%) and Consumer Staples (-2.51%).
| Q3 | YTD | 1 years | 3 years | 5 years | |
| Energy | 15.88 | 5.36 | 16.84 | 43.18 | 6.93 |
| Communication Services | 5.73 | 29.48 | 20.67 | 5.07 | 8.14 |
| Financials | 3.42 | 1.10 | 8.72 | 15.66 | 5.75 |
| Health Care | 1.29 | -3.41 | 1.41 | 7.91 | 8.50 |
| Materials | 0.08 | 0.39 | 9.26 | 9.05 | 7.55 |
| Industrials | -1.25 | 6.66 | 16.66 | 10.19 | 6.93 |
| Consumer Discretionary | -1.70 | 19.72 | 8.44 | 5.52 | 8.56 |
| Information Technology | -2.18 | 28.53 | 25.34 | 11.91 | 16.93 |
| Consumer Staples | -2.51 | -4.24 | -0.76 | 5.14 | 6.33 |
| Real Estate | -3.27 | -7.57 | -9.41 | 1.32 | 1.47 |
| Utilities | -5.47 | -10.59 | -7.89 | 3.21 | 5.53 |
Source: Morningstar as of 30th September 2023. Total Returns in GBP. MSCI World Indexes.
Fixed Income
High Yield was the top-performing sector within fixed income over the quarter, with global high yield up 4.25% in sterling terms. The Bloomberg Global Aggregate Index rose 0.43% in sterling terms in Q3 (but declined by 3.59% in dollar terms).
Corporates outperformed government bonds as the Bloomberg Global Aggregate Corporate Bond Index rose 1.30% compared to -0.19% for the Bloomberg Global Treasury Index. The story is the same in the UK and Europe, while government bonds outperformed corporates in the US.
- Bond Watch: here’s why bond prices keep on falling
- Everything you need to know about investing in gilts
In the UK, gilts and index-linked bonds fell 0.63% and 5.21% respectively as the BoE raised rates to 5.25% in August, although the central bank opted to pause its rate hikes in September as inflation has shown signs of slowing.
The UK 2-year gilt yield fell from 5.26% to 4.90%, while the 10-year yield fell from 4.39% to 4.44%. In the US, 2-year Treasury yields rose from 4.87% to 5.05% and 10-year yields rose from 3.81% to 4.57%.
| Q3 | YTD | 1 year | 3 years | 5 years | |
| Global High Yield | 4.25 | 3.84 | 3.10 | 1.81 | 3.19 |
| Sterling Corporate | 2.24 | 1.16 | 7.44 | -5.91 | -0.94 |
| EURO Corporate | 1.37 | 0.16 | 2.45 | -5.34 | -1.67 |
| Global Corporate | 1.30 | -1.08 | -5.04 | -2.78 | 2.40 |
| Global Aggregate | 0.43 | -3.62 | -6.49 | -5.13 | -0.31 |
| Global Government | -0.19 | -5.02 | -7.61 | -6.71 | -1.29 |
| UK Gilts | -0.63 | -4.09 | -2.47 | -11.33 | -3.95 |
| Global Inflation Linked | -1.13 | -3.99 | -7.26 | -5.04 | -0.11 |
| UK Inflation Linked | -5.21 | -8.01 | -13.53 | -14.10 | -5.42 |
Source: Morningstar as of 30 September 2023. Total Returns in GBP. Global Aggregate: Bloomberg Global Aggregate, Global Government: Bloomberg Global Treasury, UK Gilts: FTSE Act UK Conventional Gilts All Stocks. Global Corporate: Bloomberg Global Corporate, Sterling Corporate: ICE BofA Sterling Non-Gilt, Euro Corporate: Markit iBoxx EUR, Global High Yield: ICE BofA Global High Yield, Global Inflation Linked: Bloomberg Global Inflation Linked, UK Inflation Linked: Bloomberg Global Inflation Linked UK.
Commodities and Alternatives
The TReuters/CoreCommodity index saw a large increase of near 15% over the quarter driven by the surge in oil prices after Saudi Arabia and Russia extended oil production cuts to the end of the year. Brent crude oil rose near 33% over the quarter in GBP terms.
| Q3 | YTD | 1 year | 3 years | 5 years | |
| Volatility | 34.28 | -20.32 | -49.32 | -11.06 | 9.08 |
| Brent Crude Oil | 32.54 | 9.34 | -0.90 | 35.12 | 4.25 |
| Commodity | 14.65 | 4.89 | 1.80 | 29.15 | 11.26 |
| Global Natural Resources | 8.02 | -0.98 | 7.72 | 21.48 | 7.80 |
| Hedge Funds | 6.76 | 0.02 | -13.77 | 18.79 | 10.56 |
| Cash | 5.61 | 2.39 | -4.03 | 3.96 | 3.22 |
| Gold | 2.41 | 1.78 | 2.33 | 1.72 | 11.06 |
| UK REITs | 1.33 | -6.91 | -2.71 | -2.39 | -4.03 |
| Global REITs | -1.66 | -5.48 | -6.06 | 3.50 | 1.03 |
| Global Infrastructure | -3.42 | -5.13 | -2.25 | 9.42 | 5.45 |
| Bitcoin | -7.39 | 60.53 | 25.39 | 38.48 | 34.24 |
Source: Morningstar as of 30 September 2023. Total Returns in GBP. Global REITS: FTSE EPRA Nareit Developed, UK REITs: FTSE EPRA Nareit UK, Gold: LBMA Gold Price AM, Oil: Oil Price Brent Crude, Global Infrastructure: S&P Global Infrastructure, Natural Resources: S&P Global Natural Resources, Commodities: TReuters/CoreCommodity CRB, Hedge Funds: Morningstar Broad Hedge Fund, Volatility: CBOE Market Volatility (VIX), Cash: ICE LIBOR 1 Month, Bitcoin: MarketVector Bitcoin.
Most-traded shares on the ii platform in Q3 2023
Most-bought shares on ii platform in Q3 2023 |
Most-sold shares on ii platform in Q3 2023 |
These articles are provided for information purposes only. Occasionally, an opinion about whether to buy or sell a specific investment may be provided by third parties. The content is not intended to be a personal recommendation to buy or sell any financial instrument or product, or to adopt any investment strategy as it is not provided based on an assessment of your investing knowledge and experience, your financial situation or your investment objectives. The value of your investments, and the income derived from them, may go down as well as up. You may not get back all the money that you invest. The investments referred to in this article may not be suitable for all investors, and if in doubt, an investor should seek advice from a qualified investment adviser.
Full performance can be found on the company or index summary page on the interactive investor website. Simply click on the company's or index name highlighted in the article.