The investment trusts finding value in Brexit
Brexit has made UK stocks cheaper than almost any other market. Here are the trusts taking advantage.
29th March 2019 14:38
This content is provided by Kepler Trust Intelligence, an investment trust focused website for private and professional investors. Kepler Trust Intelligence is a third-party supplier and not part of interactive investor. It is provided for information only and does not constitute a personal recommendation.
Material produced by Kepler Trust Intelligence should be considered a marketing communication, and is not independent research.
Brexit has made UK stocks cheaper than almost any other market. Here are the trusts taking advantage.

It is almost three years since the UK voted to leave the EU. It seems like it might possibly happen, although we wouldn't want to make any more precise predictions than that.
The political picture still remains cloudy, and it would be a brave investor who made a decision based on these tea leaves. However, the ending of the article 50 period is a good moment to take stock and get a clearer picture of what has actually happened to the UK market since June 2016.
Amidst the noise and, at times, the panic, global markets and to a lesser extent UK equities have actually made strong gains.
Despite this, UK valuations, as a result of the apocalyptic headlines surrounding this never-ending fiasco, remain at rock bottom in relative terms - which makes this an interesting time to look past the headlines and discover what's really going on.
Market overview
It is hard to remember now, but when the UK voted to leave the EU there were concerns that it could be a systemic threat to the global economic system.
Fund managers reported that overseas investors, particularly in the US, were concerned that it could lead to problems of a similar scale to the Euro debt crisis of 2011.
As the graph below, these views proved to be sorely mistaken. As it turns out, the UK actually IS an irrelevant island off the north coast of Europe in terms of the global economic system…
Despite the naysayers, for UK investors the intervening period has been extremely successful. Sterling investors have made 25% in UK equities since the day of the referendum, judging by the FTSE All Share.
Even better returns have been gained from investing abroad: every UK pound invested in the S&P 500 is now worth over £1.50 thanks to the rise of that market in dollars and the strengthening of the US currency.
Even after the 2018 sell-off, an investment in emerging markets has seen comparable returns, with the MSCI index up almost 50% in sterling.
Performance of major markets in sterling since referendum

Source: FE Analytics
Currency
Sterling's depreciation has been significant, but the pound is not as low as some might think having staged a something of a recovery through 2017. In fact, sterling is down 10.5% against the dollar and 10.7% against the euro, since 23 June 2016 (the day of the vote). This represents a significant recovery, from the initial reaction to the vote: the lows against the dollar came in January 2017, when the pound was down 18%. Against the euro, the lows came later: by the end of August 2017 the pound was down 17.6%.
As the graph below shows, through 2017, dollar weakness saw the pound and euro rise against the dollar, and in April 2018 the pound was only 3% down from its pre-referendum levels. However, from that month the pound declined again significantly. This was due to risk aversion hitting global markets: all major currencies declined against the dollar as the world digested the significance of the threats of a trade war between the US and China.
Pounds and euros in dollars

Source: FE Analytics
Equity markets also fell during this period, with global markets lagging the US, which enjoyed safe haven status. It is worth noting that through this period the pound did not materially underperform most major currencies and the UK equity market did not materially underperform other non-US markets.
This might be quite surprising as one might have expected Brexit to have caused a compounding effect on the UK's sensitivity to the global market weakness, but none is evident.
Clearly during that phase, the 'bad news was in the price', although there remains the risk that a disorderly Brexit is not priced in, and there could be further currency weakness to come in a "no-deal" scenario.
Small v Large
One consequence of the depreciation of the currency since June 2016 has been the outperformance of large caps. The FTSE 100 index of larger companies has outperformed the small and mid-cap indices since the day before the Brexit vote.
In fact, even if we look at returns from the post-vote nadir (28th June 2016), the same is still true. This is a well-established phenomenon, and it is explained by the greater exposure of the small and mid-cap index to domestic earnings rather than overseas earnings, which has led to investors selling the SMIDs and buying large caps when the currency depreciates.
However, what might not be appreciated is that it is the small and mid-caps recovered from the post-vote crash to be ahead of the large caps within a year, and for much of the period between now and the vote investors in SMIDs were ahead of investors in large caps.
The below relative performance graph shows how various SMID indices have done relative to the FTSE 100 since the vote.
An upwards sloping line indicates a period of outperformance of the FTSE 100, and periods when the lines are above the base line are periods in which investors were sitting on higher returns than they would have been in large caps.
The Numis Smaller Companies ex IT index, which best represents the opportunity set of the smaller companies managers, was ahead of the FTSE 100 from June 2017 to November 2018, but the underperformance since the start of Q4 means it no longer looks so good.
Relative performance of market segments

Source: FE Analytics
The trend changed around April or May last year, and since September the underperformance of UK SMIDs accelerated.
This was a period of global risk aversion so it is no surprise that the riskier small caps were relatively out of favour.
The importance of the currency to the market cap segments can be seen below. We have calculated the correlation coefficients for the major indices against the sterling / dollar exchange rate since June 2016.
In the table below, a positive number describes a positive correlation, and means that when the pound rose in value against the dollar, the index or sector in question did too.
A negative number describes the opposite relationship, and means that when the pound rose against the dollar the investment fell. We include below the data calculated monthly, but the daily figures are much the same.
Looking at the table, we can see that the mid and small caps have tended to rally when the pound has. In other words, when international aversion to the UK has abated, the SMIDs have done particularly well.
On the other hand, the FTSE 100 shows significant negative correlation – when the pound falls in value the index has done better. Over 70% of revenues from the large cap index comes from overseas, and so their revenues have been rising in sterling as the currency has fallen.
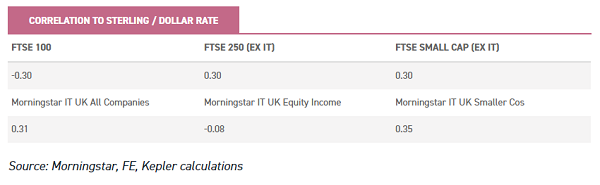
Source: Morningstar, FE, Kepler calculations
We have also calculated the figures for the three UK investment trust sectors. The higher weighting to large caps in the UK Equity Income sector explains the negative correlation of that sector's NAV total return average to the strength of sterling, although we would note that the relationship is very weak.
The more mid-cap focused All Companies sector and the Smaller Companies sector display similar correlations to the pound as the relevant indices.
According to Morningstar data, the UK Equity Income sector has on average 43% invested in large caps, compared to just 19% for the UK All Companies sector.
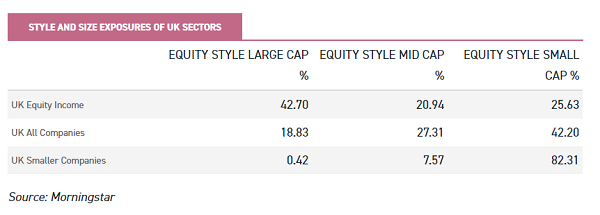
Source: Morningstar
However, the domestic bias of small and mid-cap companies is easy to overestimate, and investors risk throwing the baby out with the bathwater if they avoid exposure to the UK small cap market entirely. The proportion of overseas revenues in the Numis Smaller Companies ex IT index is roughly 40%.
While this is much lower than the 70% plus for the FTSE 100, it does establish that UK SMIDs are by no means only domestic players. Furthermore, we would underline that there are plenty of individual stocks in the market with minimal exposure to the UK.
Only 10% of industrial engineer Rotork (LSE:ROR) revenues come from the UK, for example. Renishaw (LSE:RSW), the precision measurement tools manufacturer, earns only 6% of its revenue in the UK and Ireland. Renishaw has doubled since the 2016 vote and Rotork is up 50%.
Plenty of companies, then, have made investors good returns even when sentiment to the UK SMIDs is low, which is an important consideration for those who would shun the market entirely.
Small and mid-cap stocks which are selling more abroad, particularly, are able to do well in the long run whatever the outcome of the Brexit negotiations, especially if they sell off with the market on Brexit-related sentiment.
One trust that invests in companies like this is Invesco Perpetual UK Smaller (LSE:IPU). IPU has been tilting its portfolio to companies with overseas revenues, with around 50% of the earnings on its portfolio coming from abroad.
For example, industrial threads maker Coats Group (LSE:COA) derives 51% of its revenues from Asia and 31% from the Americas, with only 18% coming from "EMEA", which includes the UK. The stock is the second largest in the IPU portfolio at 3.1%.
IPU's portfolio typically comprises around 80-90 holdings, with no position allowed to get much bigger than 3% of NAV – an approach that the managers say means they can sleep at night.
However, the current uncertain political environment has translated into a desire to invest in only those companies they have a high degree of confidence in. As a result, the number of holdings in the portfolio has dropped to only c. 71 holdings.
Although it has exposure to some high-growth stocks, the team are agruably more "valuation aware" than many peers who might have a more aggressive approach to "running winners".
Their approach has stood them in good stead since the start of Q4 2018. The portfolio has been performing especially strongly recently, and over both the short and medium term, the trust is currently in the top decile relative to peers over most periods.
IPU is trading on a 3.4% discount and currently yields 4.2% paying a proportion of the dividend out of capital when necessary. It. We have updated our note this week.
JPMorgan's Mercantile Investment Trust (LSE:MRC) offers more exposure to stocks further up the market cap scale. The portfolio is strongly tilted to mid-caps, with the allocation to FTSE 250 stocks in the 75% to 80% range over the past three years.
The trust is cheap in two senses: it has the lowest OCF in the sector and is also trading on a 9.5% discount, wider than the UK All Companies and UK Smaller Companies sectors. It has a track record of outperforming in rising markets thanks in part to its structural gearing.
Domestic v International Earnings
It is possible to isolate domestic earners against those with more international exposure fairly precisely using FTSE indices. The FTSE Local UK index includes those companies in the FTSE 350 which derive at least 70% of their earnings from the domestic market. On a total return basis, the index is down 3% since the day of the referendum result, which compares to the over 25% gains from the All Share.

Source: FE Analytics
This modest performance is reflected in the current price to earnings (PE) ratio. On a forward basis, going by Bloomberg estimates, the local index is trading on a PE of just 13 times compared to 19 times for the index as a whole.
However, interestingly, the size of this disparity has not grown significantly since before the referendum.
The forward PE on both indices has fallen but the difference between them remained roughly the same.
This means that analysts' estimates of the future earnings of the local-focused companies have come down by a commensurate amount and speaks to the danger of buying domestic earners indiscriminately on "value" grounds.
If there are opportunities out there, finding them will be a matter of deciding which stocks' futures are being unfairly discounted due to Brexit concerns.
Keystone (LSE:KIT), managed by James Goldstone at Invesco, is one trust currently trying to do just that. James takes a bottom-up all-cap approach to building a UK equity portfolio, with a strong emphasis on valuations.
James' approach has led him into companies with domestic earnings streams in recent years as they have been sold down by the market. James believes that the valuations on companies dependent on the UK economy have become irrational due to the ongoing uncertainty around Brexit.
James' largest position is in Barclays (LSE:BARC), for example, whose UK business he believes is undervalued, and he also holds RBS (LSE:RBS).
The exposure to domestic value - around 40% of the portfolio – is balanced by holdings in more growth-y names such as Coats Group (LSE:COA) and On The Beach (LSE:OTB). Although it sits in the UK All Companies sector and doesn't have an income mandate it is yielding 3.5% thanks to the low valuations in the UK. It is trading on a 12.2% discount compared to an 8.3% sector average.
Growth v Value
On a headline index level, value has actually outperformed growth in the UK since the 2016 vote, according to the MSCI indices. This is in contrast to the global equity markets where it is growth that has dominated in recent years with only short-lived reversals of this trend.

Source: FE Analytics
However, this seems to be explained by the large cap / overseas earnings effect discussed above. If we drill down, it is large cap value which has outperformed the growth index, while mid and small cap value stocks have performed more or less in line with the growth index.

Source: FE Analytics
This makes sense, as many of the constituents of the large cap value index are those that are most helped by weak sterling due to their high levels of overseas earnings – energy, materials, tobacco.
This explains why the UK sits out from the global pattern of renewed outperformance of growth against value, so the apparent outperformance of value over growth is really just the same currency effect from a different angle.
In other words, the elastic remains stretched back, and value remains out of favour versus growth in the UK small and mid-cap space. For believers in mean reversion, this could be promising.
One trust which is squarely positioned in the 'value' camp is Aberforth Smaller Companies (LSE:ASL). This trust has been run with an unabashedly 'value' approach since the early 1990s and is a well known option for professional investors looking for undiluted value exposure in the small cap space.
The managers have been finding opportunities in unloved domestic earners in recent years, such as transport operator First Property Group (LSE:FPO) and retailer Dunelm Group (LSE:DNLM). Although the long-term track record has been strong, in recent years the trust has underperformed thanks to the value approach being out of favour.
Aberforth therefore offers exposure to the out-of-favour value style in the out-of-favour small-cap segment in the out-of-favour UK market – potentially a treble-whammy if things were to reverse. As such, should the UK's future relationship to the EU be resolved in whole or in part, this trust could therefore have extreme reversion potential. The trust is trading on a wide discount of 16.8% and yielding 2.8%.
Conclusion
The UK is cheap relative to other markets and to its own history on valuation grounds, although there is risk of continuing volatility for some time. On a headline basis, only the emerging markets index is cheaper than the UK on a forward PE basis. On the other hand, the UK is itself only moderately cheaper than the European market, as the table below shows.

Source: Bloomberg
The domestic economy is particularly hard hit, and in particular the small small-caps, which are considerably cheaper than the wider market.
With domestic earners in mind, we believe that while Brexit may be a drag on the UK economy it will continue to be dynamic and outward-facing in the long run. In the SMIDs, the UK has many international growth companies which should be less impacted by Brexit even in a 'hard Brexit' scenario.
Companies with new technologies or products should be able to grow internationally over the long run even if UK growth is lower than it could be in a bad Brexit scenario.
In this context, the yield of 3.1% and discount of 9.8% on the AIC UK Smaller Companies sector stands out. All three UK equity sectors are at a significant discount to their global equivalents, as the table below shows.
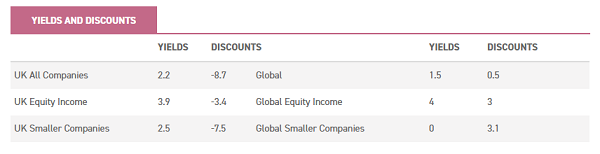
Source: JPMorgan Cazenove, as at 14.03.19
Invesco Income Growth (LSE:IVI) offers a more cautious route to UK exposure. Manager Ciaran Mallon focuses on bottom-up fundamentals and takes a cautious approach to portfolio construction without making big macro or sector calls.
The trust therefore offers exposure to the UK market without making a massive call on domestic versus international revenues or small versus large caps.
The trust is on a chunky 14.5% discount, and offers a yield of 4.3% is attractive. Ciaran has increased gearing slightly in recent months from a net cash position to roughly 4% of net assets.
This is to take advantage of the late 2018 sell-off in specific stocks such as RBS and Phoenix (LSE:PHNX), and he tells us he has a list of companies he is keen to buy or top up should there be any more volatility in the UK market during the Brexit process. We have updated our note this week.
One fund manager who is very bullish on the opportunity in the UK market is Alex Wright, manager of Fidelity Special Values (LSE:FSV).
Wright believes that the level of aversion to the UK has created a fertile field for contrarian stock pickers, although some companies are justly out of favour too, and so investors have to do detailed research to avoid these.
He runs a highly diversified portfolio and has been tilting the trust more toward undervalued large caps in recent months, as he believes some domestic facing stocks in that segment are looking attractively valued. In our view the main drawback of the trust is the 1.5% premium, as there are other trusts with exposure to undervalued UK stocks without that high rating. We have updated our note on the trust this week.
Kepler Partners is a third-party supplier and not part of interactive investor. Neither Kepler Partners or interactive investor will be responsible for any losses that may be incurred as a result of a trading idea.
Full performance can be found on the company or index summary page on the interactive investor website. Simply click on the company's or index name highlighted in the article.
Important Information
Kepler Partners is not authorised to make recommendations to Retail Clients. This report is based on factual information only, and is solely for information purposes only and any views contained in it must not be construed as investment or tax advice or a recommendation to buy, sell or take any action in relation to any investment.
This report has been issued by Kepler Partners LLP solely for information purposes only and the views contained in it must not be construed as investment or tax advice or a recommendation to buy, sell or take any action in relation to any investment. If you are unclear about any of the information on this website or its suitability for you, please contact your financial or tax adviser, or an independent financial or tax adviser before making any investment or financial decisions.
The information provided on this website is not intended for distribution to, or use by, any person or entity in any jurisdiction or country where such distribution or use would be contrary to law or regulation or which would subject Kepler Partners LLP to any registration requirement within such jurisdiction or country. Persons who access this information are required to inform themselves and to comply with any such restrictions. In particular, this website is exclusively for non-US Persons.
The information in this website is not for distribution to and does not constitute an offer to sell or the solicitation of any offer to buy any securities in the United States of America to or for the benefit of US Persons.
This is a marketing document, should be considered non-independent research and is subject to the rules in COBS 12.3 relating to such research. It has not been prepared in accordance with legal requirements designed to promote the independence of investment research.
No representation or warranty, express or implied, is given by any person as to the accuracy or completeness of the information and no responsibility or liability is accepted for the accuracy or sufficiency of any of the information, for any errors, omissions or misstatements, negligent or otherwise. Any views and opinions, whilst given in good faith, are subject to change without notice.
This is not an official confirmation of terms and is not to be taken as advice to take any action in relation to any investment mentioned herein. Any prices or quotations contained herein are indicative only.
Kepler Partners LLP (including its partners, employees and representatives) or a connected person may have positions in or options on the securities detailed in this report, and may buy, sell or offer to purchase or sell such securities from time to time, but will at all times be subject to restrictions imposed by the firm's internal rules. A copy of the firm's conflict of interest policy is available on request.
Past performance is not necessarily a guide to the future. The value of investments can fall as well as rise and you may get back less than you invested when you decide to sell your investments. It is strongly recommended that Independent financial advice should be taken before entering into any financial transaction.
PLEASE SEE ALSO OUR TERMS AND CONDITIONS
Kepler Partners LLP is a limited liability partnership registered in England and Wales at 9/10 Savile Row, London W1S 3PF with registered number OC334771.
Kepler Partners LLP is authorised and regulated by the Financial Conduct Authority.
Kepler Partners is a third-party supplier and not part of interactive investor. Neither Kepler Partners or interactive investor will be responsible for any losses that may be incurred as a result of a trading idea.
These articles are provided for information purposes only. Occasionally, an opinion about whether to buy or sell a specific investment may be provided by third parties. The content is not intended to be a personal recommendation to buy or sell any financial instrument or product, or to adopt any investment strategy as it is not provided based on an assessment of your investing knowledge and experience, your financial situation or your investment objectives. The value of your investments, and the income derived from them, may go down as well as up. You may not get back all the money that you invest. The investments referred to in this article may not be suitable for all investors, and if in doubt, an investor should seek advice from a qualified investment adviser.
Full performance can be found on the company or index summary page on the interactive investor website. Simply click on the company's or index name highlighted in the article.
Important Information
Kepler Partners is not authorised to make recommendations to Retail Clients. This report is based on factual information only, and is solely for information purposes only and any views contained in it must not be construed as investment or tax advice or a recommendation to buy, sell or take any action in relation to any investment.
This report has been issued by Kepler Partners LLP solely for information purposes only and the views contained in it must not be construed as investment or tax advice or a recommendation to buy, sell or take any action in relation to any investment. If you are unclear about any of the information on this website or its suitability for you, please contact your financial or tax adviser, or an independent financial or tax adviser before making any investment or financial decisions.
The information provided on this website is not intended for distribution to, or use by, any person or entity in any jurisdiction or country where such distribution or use would be contrary to law or regulation or which would subject Kepler Partners LLP to any registration requirement within such jurisdiction or country. Persons who access this information are required to inform themselves and to comply with any such restrictions. In particular, this website is exclusively for non-US Persons. The information in this website is not for distribution to and does not constitute an offer to sell or the solicitation of any offer to buy any securities in the United States of America to or for the benefit of US Persons.
This is a marketing document, should be considered non-independent research and is subject to the rules in COBS 12.3 relating to such research. It has not been prepared in accordance with legal requirements designed to promote the independence of investment research.
No representation or warranty, express or implied, is given by any person as to the accuracy or completeness of the information and no responsibility or liability is accepted for the accuracy or sufficiency of any of the information, for any errors, omissions or misstatements, negligent or otherwise. Any views and opinions, whilst given in good faith, are subject to change without notice.
This is not an official confirmation of terms and is not to be taken as advice to take any action in relation to any investment mentioned herein. Any prices or quotations contained herein are indicative only.
Kepler Partners LLP (including its partners, employees and representatives) or a connected person may have positions in or options on the securities detailed in this report, and may buy, sell or offer to purchase or sell such securities from time to time, but will at all times be subject to restrictions imposed by the firm's internal rules. A copy of the firm's conflict of interest policy is available on request.
Past performance is not necessarily a guide to the future. The value of investments can fall as well as rise and you may get back less than you invested when you decide to sell your investments. It is strongly recommended that Independent financial advice should be taken before entering into any financial transaction.
PLEASE SEE ALSO OUR TERMS AND CONDITIONS
Kepler Partners LLP is a limited liability partnership registered in England and Wales at 9/10 Savile Row, London W1S 3PF with registered number OC334771.
Kepler Partners LLP is authorised and regulated by the Financial Conduct Authority.
These articles are provided for information purposes only. Occasionally, an opinion about whether to buy or sell a specific investment may be provided by third parties. The content is not intended to be a personal recommendation to buy or sell any financial instrument or product, or to adopt any investment strategy as it is not provided based on an assessment of your investing knowledge and experience, your financial situation or your investment objectives. The value of your investments, and the income derived from them, may go down as well as up. You may not get back all the money that you invest. The investments referred to in this article may not be suitable for all investors, and if in doubt, an investor should seek advice from a qualified investment adviser.
Full performance can be found on the company or index summary page on the interactive investor website. Simply click on the company's or index name highlighted in the article.