Kepler Trust report: City of London Investment Trust
City of London's objective is to provide long-term growth in income and capital.
21st October 2019 13:15
This content is provided by Kepler Trust Intelligence, an investment trust focused website for private and professional investors. Kepler Trust Intelligence is a third-party supplier and not part of interactive investor. It is provided for information only and does not constitute a personal recommendation.
Material produced by Kepler Trust Intelligence should be considered a marketing communication, and is not independent research.
City of London's (CTY) objective is to provide long-term growth in income and capital. It is also true that a rising level of dividend income is a very important part of what CTY aims to provide for shareholders.

William Heathcoat Amory is the founder of Kepler Trust Intelligence.
Summary & Portfolio
City of London (LSE:CTY) objective is to provide long-term growth in income and capital. Bearing in mind the fact that this trust has the longest track record of providing annual dividend increases in the investment trust sector – 53 consecutive years – it is also true that a rising level of dividend income is a very important part of what CTY aims to provide for shareholders.
In the context of this very long track record having been developed by the company, it is reassuring for investors that the last 28 years worth of dividend increases have been delivered by the same manager: Job Curtis. Job has sole responsibility for CTY, although as we discuss in the Management section, he leans on his team members in Janus Henderson’s global equity income team to help him form ideas about relative valuations and changing industry dynamics.
Within the mandate, the manager has a certain degree of flexibility to invest outside equities (opportunistically in fixed interest or convertibles), and outside the LSE. As at the end of June 2019, Job had 10% invested overseas, in companies which all offer either better income opportunities or non-replicable exposures to that found in the UK.
Overseas holdings (and income received in foreign currencies) have clearly had a beneficial impact over the last few years, but with the end to the Brexit process potentially looming, Job is gently positioning CTY towards more domestically-focused areas. He has built up exposure to what he views as resilient domestic themes such as UK housebuilders, and travel and leisure businesses, which should generally benefit from a rise in sterling, and which add portfolio stability.
Fundamentally, Job aims to invest in companies that have strong balance sheets, which, in share price terms, offer a margin of safety, and have demonstrably sustainable cash generation to support both dividends and capital expenditure for the future growth of the company. He likes to spread investments across a wide variety of companies.
The board has encouraged him to concentrate the portfolio very slightly, which over the last financial year saw the number of stocks come down from 117 to 97.
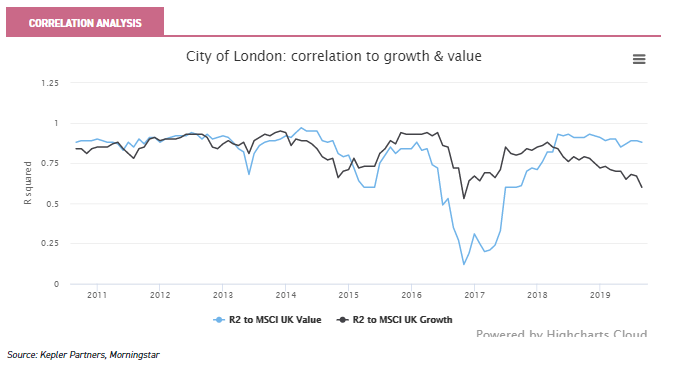
Valuations are an important determinant in the investment process. Job has been paring back exposure to what he views as very highly rated ‘quality growth’ stocks, and reinvesting in high quality cyclicals and value stocks. This subtle shift shows up in our correlation analysis, and CTY has recently become more highly correlated with ‘value’, whilst correlation to ‘growth’ has declined.
In our view, this is an interesting by-product of the investment process of CTY and a cautious UK equity income mandate. As a pragmatic and experienced manager, Job instinctively sells into ‘hot’ areas of the market, recycling into less well-appreciated areas.
NAV total returns over both the long- and the short-term have been ahead of the FTSE All Share index – which this year replaces the AIC UK Equity Income peer group as the benchmark. Job’s style means he is not aiming to ‘shoot the lights out’ in any one year by having particularly large weightings to any one sector.
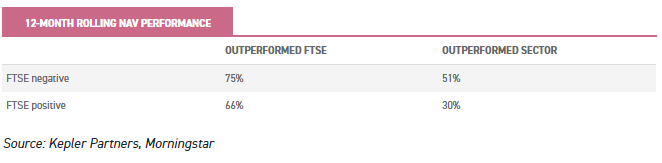
As such, he expects to outperform gradually over the medium to long term, and fully accepts that over short periods, he may underperform. We observe that the dividend focus and investment strategy generally lends itself to the trust outperforming during periods of market difficulty; since June 2008, the trust has outperformed the FTSE and the Morningstar Equity Income sector more often during periods where the FTSE All Share has fallen over the previous 12 months. Conversely, it has tended to lag in rising markets.
At the current price, the shares yield 4.5%, a decent premium to the AIC UK Equity Income sector weighted average of 3.9%. One of the key selling points of CTY is its dividend track record, which has seen the board pay an increased dividend for the past 53 consecutive years – the longest track record in the investment trust sector. The board has been able to add to revenue reserves for the past seven years, such that revenue reserves (as at 30 June 2019) are were 0.83x the current dividend level of 18.6p per share.
A premium rating has for quite some time been the norm for the trust. The board’s aim is that the share price should “reflect closely its underlying asset value” but also to reduce discount volatility. The company continues to issue shares, which over time has enabled the board to negotiate lower fees with Janus Henderson. The OCF was 0.39% in the last financial year, and the board predicts it will fall further once recently negotiated lower management fees have had a full year’s impact.
This subtle shift shows up in our correlation analysis, using CTY’s R squared to MSCI’s UK growth and value indices. As the graph below shows, CTY has traditionally had a relatively even balance towards both, but for the first time since 2011 (our analysis period), the trust’s correlation between the two styles has diverged sharply, becoming more highly correlated with value, whilst correlation to growth has declined.
In our view, this is an interesting by-product of the investment process of CTY and a cautious UK equity income mandate. As a pragmatic and experienced manager, Job instinctively sells into ‘hot’ areas of the market, recycling into less well appreciated areas; he explained to us that he had not explicitly targeted the correlations below, but that they were in line with what he would have expected from his trading activity.
Job uses the benchmark as a sense check on the shape of the portfolio, and generally prefers large caps.
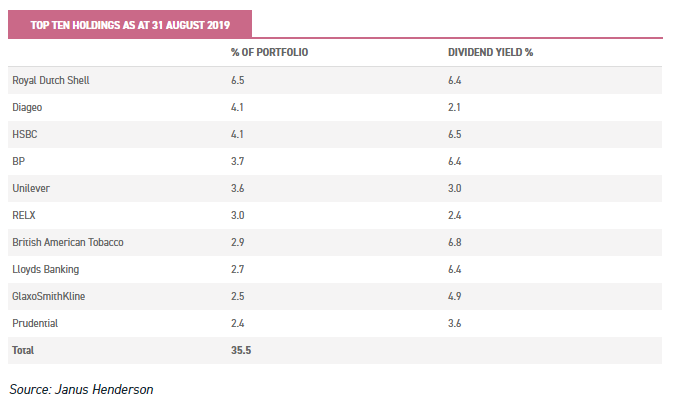
Indeed, recognising that the FTSE 250 has a lot of challenged businesses, which may turn out to be value traps, his weighting to the FTSE 100 has continued to creep up from 69% two years ago to 78% as at 30 June 2019.
As the table below shows, none of the holdings is allowed to get particularly large – either in capital terms, or as regards contribution to revenues. By our calculations, the total contribution to revenues from the top ten is c. 36.6%, which is roughly in line with the portfolio weighting of these holdings.
When we met up with Job recently, he discussed three of the various themes prevalent within the portfolio currently.
The first theme we discussed was UK housebuilders, which Job has been adding exposure to. He currently has three holdings – Taylor Wimpey (LSE:TW.), Persimmon (LSE:PSN) and Berkeley (LSE:BKG), together adding up to 3.6% of the portfolio. In his view, these companies are well placed to continue to meet structurally growing demand for new homes in the UK.
One of the eventualities which Job sees as a possibility is that the UK strikes a (favourable?) deal with the EU, in which case sterling would experience a big bounce. He has also identified a political imperative for the Conservative Party to increase home-ownership, noting that a rise in property ownership typically benefits the Tories.
As such, Job believes housebuilders offer good value, and more importantly, are unlikely to be affected by currency swings, which will provide an element of stability to the portfolio and income account.
In the same way, Job has also been building up exposure in the travel and leisure sectors, believing that trends in growth in demand for experiences above that for tangibles will likely continue. In total, Job has around 6.6% of the portfolio invested here currently, and has been a beneficiary of the takeover (not yet completed) of Greene King (LSE:GNK) by Li Ka-shing.
The third theme Job highlights is the structural growth in demand for savings products and advice, driven by demographic and economic trends.
In his view, the impact of the defined contribution pension revolution in the UK is only just starting and he expects strong and consistent growth in demand for savings products and advice.
He owns several holdings amounting to a total of 5.8%, including a new holding in St James’s Place (LSE:STJ), which represents 1.4% of NAV. Whilst St James’s Place has attracted some negative headlines in recent months around its charging structure, Job noted that he believes this is due to some misconceptions around how fees are levied. He also noted that the fee structure meant that, even if (in what he views as the unlikely event) the company does not grow assets further, the charging structure is such that the asset base it receives fees on will continue to grow.
Job notes that many client portfolios are subject to an initial fee, but then no ongoing fee for several years; a very sizeable volume of assets each year matures past this initial stage and becomes subject to ongoing management fees.
In view of the current burst of enthusiasm for all things environmental, we quizzed Job on his significant exposure to oil stocks BP (LSE:BP.) and Royal Dutch Shell (LSE:RDSB).
In his view, each has achieved significant reductions in costs and each is well set for delivering a strong dividend stream for the foreseeable future.
That fossil fuels will continue to make up the energy mix for quite some time is undeniable, and both are making strides towards renewables, although he admitted that the jury was out whether they could achieve similarly dominant positions in 'new' energy. Job emphasises that dividend yield is a key attraction for him when selecting investments – he tries to achieve a blend of higher and lower yielding companies through the portfolio but running an equity income fund without oil, resources or tobacco would be almost impossible.
Such is the level and sustainability of dividends from these stocks, he has sympathy with the idea that they would be worth holding even if they were effectively in run-off (not that this is his view). Both majors are relatively resilient to movements in the oil price at present, and believe they can expand margins further through pricing pressure on oil services companies.
Furthermore, as well as their nascent steps into renewable energy markets, they have significant exposure to the (admittedly lower-margin) natural gas market, where steady demand growth is likely to continue, particularly as certain economies (such as China) seek to replace growth in coal power generation.
Overall, Job continues to believe that dividends form a decent part of overall returns for the vast majority of companies. In his view, selecting those companies that have the discipline of paying consistent and growing dividends results in a high-quality portfolio, which should over time outperform passive equity indices.
Gearing
CTY uses a mixture of strategic and tactical gearing with the aim of boosting returns. Gearing (borrowing to fund investments) can accelerate returns, but it is important to remember that it can also accentuate losses. Strategic gearing is fixed long-term gearing which is likely to remain employed at all times, whilst tactical gearing is more flexible and which Job decides when to employ (or not).
CTY has two historic and very expensive debentures, which are now within sight of their redemption dates. Whilst relatively small in the context of the NAV, this is good news for the trust, both from an income perspective and a capital perspective. These debentures (£10 million paying coupons of 10.25% and £30m paying 8.5%) mature in 2020 and 2021, which means that distributable income will marginally increase.
The other strategic gearing is represented by two relatively low-cost privately placed loans: £35m paying 4.53% and maturing in 2029, and another of £50m paying 2.94%, redeeming in 2049. In addition, the trust has a £120m overdraft facility, which attracts interest payable at 1.25% above the base rate to the extent that it is drawn. The trust has a policy that this fixed rate gearing will usually be fully invested, but there have been times when the gearing effect has been reduced by selling a FTSE 100 Future.
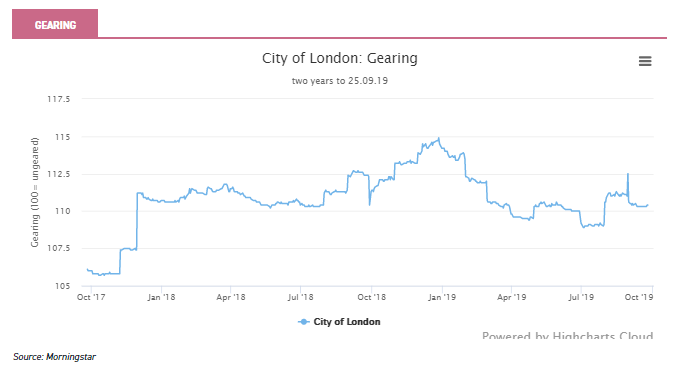
The tactical gearing facility is managed, on an opportunistic basis, by Job in consultation with the chairman and the board. Typically, Job looks at a range of absolute measures (such as P/E ratios) relative to history as well as the yields available on stocks to determine what level of gearing he finds appropriate. As an absolute maximum, total gearing will not exceed 20% of NAV at the time of drawdown. As the graph below shows, gearing is actively managed over time.
Currently, only the fixed rate borrowings – amounting to 9% of NAV – are employed (as at the end of August 2019). Overall, Job believes that the portfolio beta is typically in the order of 0.9-0.95. This means that with the structural gearing employed, this doesn’t necessarily mean that the trust at the NAV level will be significantly more exposed to market moves.
Performance
The trust’s objective is to provide long-term growth in income and capital. However, providing a progressive dividend to shareholders is a key requirement from the board. As we detail in the Dividend section, the trust has delivered on this admirably, generating 53 years of consecutive dividend increases – the longest track record of doing so in the investment trust sector.
In terms of total return performance, the board recently changed the benchmark to the FTSE All Share index. Previously, this was the weighted average of the AIC UK Equity Income peer group. Aside from the fact that CTY is amongst the largest trusts in the sector (thereby influencing its own benchmark), the makeup of the equity income peer group is increasingly less consistent.
As such, it seems entirely logical that the board should make this change. Certainly, it comes from a position of strength (the trust was ahead of the previous benchmark over one, three, five and ten years at 30 June 2019). But it also doesn’t represent a huge change in practical terms: the board historically ‘considered’ the performance of FTSE All Share when reviewing the trust’s performance, and now it is the official benchmark.
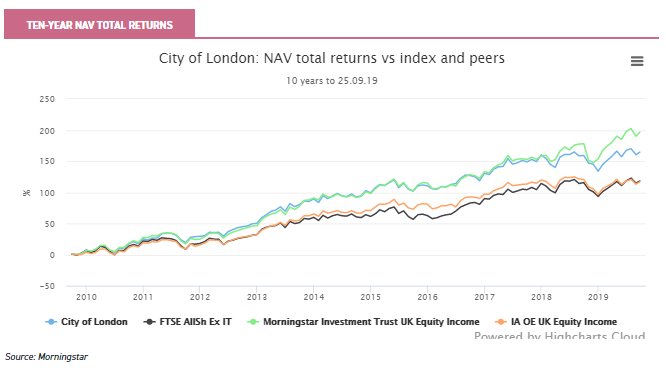
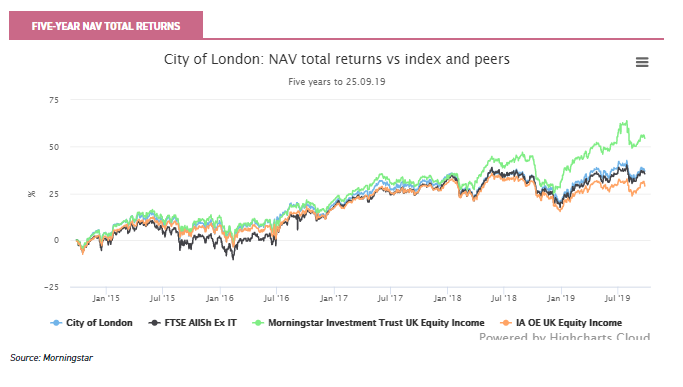
As the graph below shows, over the long term (ten years) NAV total returns have been ahead of both the FTSE All Share and the IA peer group average, but recent performance has left the trust moderately behind Morningstar’s investment trust peer group index (which is different to the weighted average peer group average – the previous benchmark).
Job’s style is one in which he aims to have a broad spread of investments, and is not aiming to ‘shoot the lights out’ in any one year by having particularly large weightings to any one sector such as mining or technology. As such, he expects to outperform gradually over the medium- to long-term, and fully accepts that over short periods, he may underperform.
The dividend focus and investment strategy generally lends itself to the trust outperforming during periods of market difficulty; since June 2008 (when NAV data is available from), the trust has outperformed the FTSE and the Morningstar sector more often during periods where the FTSE All Share has fallen over the previous 12 months. Conversely, it has tended to lag in rising markets. The data in the table below is based upon rolling 12-month returns.
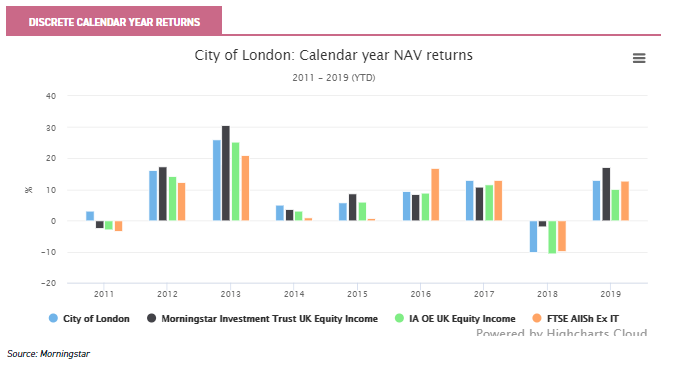
This characteristic is illustrated in the calendar year performance graph below. It illustrates the point that CTY has steadily and consistently outperformed the FTSE All Share Index in six out of the eight full years, at the same time providing a higher yield than the market. With his fundamental-based approach to understanding companies and investing in those who can sustainably grow their dividend, Job has proved he can outperform the market.
A performance chart over the last five years further highlights the effect of Job’s gentle rotation away from higher-rated stocks towards those with more ‘value’ characteristics. He remains ahead of the FTSE All Share index over this time frame.
Dividend
At the current price, CTY’s shares yield 4.5%, a decent premium to the AIC UK Equity Income sector weighted average of 3.9%. However, one of the key selling points of CTY is its dividend track record, which has seen the board pay an increased dividend for the past 53 consecutive years – the longest track record in the investment trust sector. We understand that maintaining this track record is important for the board. It seems fair to imagine that with the weight of history behind them, any board would not take the decision lightly to break the pattern of progressive dividends.
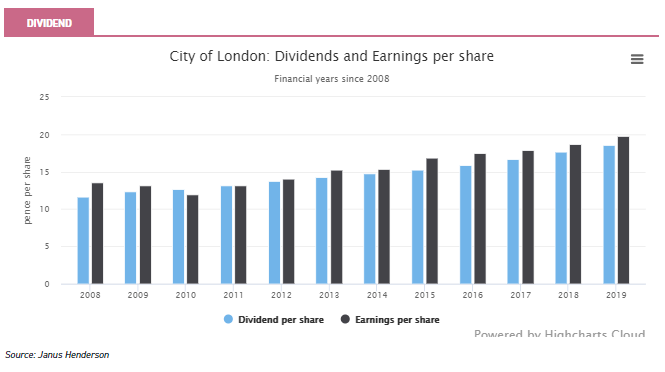
Behind this is the depth of the manager’s experience, rivalled by very few other funds or trusts, in having run the trust for over 28 years. Indeed, at the time Job took over management of the trust in 1991, the dividend paid that year was 4.56p. By applying the same investment philosophy consistently over time, he has managed to grow the dividend paid to investors to 18.6p in the last financial year, an increase of 308% and representing a compounded growth rate of 4.1% per annum.
Of course, revenue generation hasn’t necessarily increased every year, but CTY has used the advantage that investment trusts have over their open-ended peers – that of using revenue reserves to support dividends during more difficult years. Indeed, CTY has had to dip into its reserves seven times over the period in which Job has been running the trust, which does nothing to diminish his impressive feat.
For example, in the aftermath of the 2008 financial crisis, Job recalls that around 25% of FTSE 350 companies reduced or entirely cut their dividends. As a result, in the financial year ending June 2010, the company suffered an earnings fall of 9%. Dipping into its revenue reserves to the tune of 0.57p per share enabled the company to grow the dividend in the same year by 2.75% – a good result given the turmoil seen elsewhere.
CTY’s board aims to increase the dividend each year, but ideally also retain a little of the income earned for the revenue reserves. As at 30 June 2019, we calculate that revenue reserves amounted to 0.83x the current dividend level of 18.6p per share. One of the headwinds that the board faces in growing the trust through share issuance is that the revenue reserves get diluted. However, this has been somewhat mitigated by the fact that the board has been able to add to revenue reserves for the past seven years. Since 2014, the company has had an average payout ratio of 93.7% of distributable income.
As we note above, consistent dividend growth has been achieved from an underlying portfolio of conservatively run, well-financed businesses that are themselves not overdistributing (and thereby endangering the long-term sustainability of earnings).
Job also tries to ensure that he is never held hostage to fortune and thus has a good spread of investments across sectors and types of businesses. Overall, Job aims for a portfolio yield of between 110% and 130% of the FTSE All Share – currently he has been toward the lower end of the range on a relative basis.
Job also has a certain degree of flexibility in the mandate to boost income. Where opportunities present themselves, he can invest in fixed interest but also write covered options to boost income. Neither features in the portfolio to any great extent currently.
As we have observed before, writing covered options and collecting a premium for doing so works well during periods of heightened volatility (when dividends are also called into question). As such it acts as a stabiliser to income generation – at times when dividend income looks more uncertain, option writing offers a way of boosting income.
Management
Job has had responsibility for City of London since 1 July 1991. At the time he took over management the dividend paid that year was 4.56p. By applying the same investment philosophy, he has managed to grow the dividend paid to investors in the last year to 18.6p, an increase of 308% and representing a compounded growth rate of 4.1% per annum.
Job is supported by the wider team of 12 at Janus Henderson’s global equity income team, which contributes to ideas and leads company meetings. However, Job has ultimate responsibility for any stock in the portfolio, and we understand that he enjoys doing his own fundamental research. Job co-manages a £4.5 billion global equity income open-ended fund with Ben Lofthouse and Alex Crooke, which he says helps provide an international perspective on the companies he looks at listed in London. More importantly, it ensures that he always has a good handle on relative valuations and earnings growth across the world.
Job describes himself as a pragmatic investor, but one that recognises that valuations (as distinct from qualifying as a ‘value’ stock) are important in determining whether he should be adding or reducing exposure to a holding. He likes to maintain a good spread of investments recognising that diversification is likely to be crucial to maintain the enviable long-term track record of dividend growth that CTY has so far achieved. Whilst encouraged by the board to concentrate his portfolio from historic levels of c. 117, he currently retains 97 names in the portfolio. Job has c. 225,000 shares in the trust, equivalent to c. £925,000 worth.
Janus Henderson is the result of the 2017 merger between the UK’s Henderson Global Investors and the UK’s Janus Capital. Both companies offer largely bottom-up, analysis-based strategies. In total Janus Henderson manage 14 investment trusts with combined net assets of £7 billion. At £1.56 billion CTY represents a significant chunk of Janus Henderson's AuM in the trust universe.
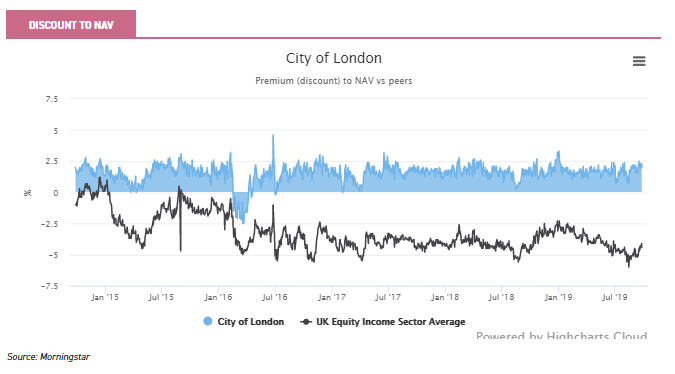
Discount
As the graph below shows, City of London continues to trade at a premium to NAV (presently c. 1.7%) – a position it has enjoyed for much of the past five years. The board’s aim is that the share price should “reflect closely its underlying asset value” but also to reduce discount volatility.
Whilst it does not believe it to be in shareholders’ interests to have a specific policy on issuance or buybacks, the board intends to consider issuance or buybacks within a narrow band to NAV.
To this end, it has been a consistent issuer of shares, and over the last financial year (to 30 June 2019) issued just under £100 million worth.
Indeed, over the nine years to June 2018, City of London has issued 170 million shares, increasing the share capital by over 80%. The board issues stock to ensure that the shares do not trade too richly relative to NAV, but as we mention in the Charges section, as the trust has grown this has meant that the OCF has reduced over time, creating a virtuous circle.
For example, in 2009 the OCF was 0.44%, compared to 0.39% in the last financial year, and predicted to fall further thanks to the board having negotiated the management fee down. CTY is the second-largest (by a wide margin to most peers) trust in the UK Equity Income sector.
Charges
CTY is the second largest trust in the UK equity income sector, and has the lowest OCF at 0.39% (financial year to 30 June 2019). Janus Henderson now charge a management fee of 0.325% of net assets, which is a saving negotiated by the board and which was reported at the last interims.
It took effect on 1 January 2019, and so the reduced fee only had a six-month impact on the OCF reported in the final results.
The new management fee basis represents a reduction of c. 10%, and the chairman has stated that he expects the ongoing charges to reduce further from the figure reported in the accounts. In our view, the low charges are one of the reasons that CTY continues to issue shares, and grow its asset base – which has proven a virtuous circle for all concerned.
There are no performance fees payable. The KID RIY is 0.88%, which compares to the UK equity income weighted average of 1.16%.
ESG
As we discuss in this article, Janus Henderson trusts tend to score highly in purely quantitative ESG measures. However, ESG per se does not feature in Job’s investment process. Certainly, with Shell, BP and BAT consistently appearing in the top ten holdings it is fair to say that CTY might not appeal to very strict ESG investors, particularly those that negatively screen stocks or sectors.
On the other hand, we understand that Janus Henderson (Henderson as was) have long been strong believers in the G of ESG – that of governance. Henderson has a dedicated team devoted to governance within companies it owns, and it takes voting at shareholder meetings very seriously. The fund managers who have responsibility for the shares are consulted on a case by case basis. In Job’s case, his particular bugbear is high executive pay when it is not deserved, which he believes is very concerning in some cases and socially divisive.
Kepler Partners is a third-party supplier and not part of interactive investor. Neither Kepler Partners or interactive investor will be responsible for any losses that may be incurred as a result of a trading idea.
Full performance can be found on the company or index summary page on the interactive investor website. Simply click on the company's or index name highlighted in the article.
Important Information
Kepler Partners is not authorised to make recommendations to Retail Clients. This report is based on factual information only, and is solely for information purposes only and any views contained in it must not be construed as investment or tax advice or a recommendation to buy, sell or take any action in relation to any investment.
This report has been issued by Kepler Partners LLP solely for information purposes only and the views contained in it must not be construed as investment or tax advice or a recommendation to buy, sell or take any action in relation to any investment. If you are unclear about any of the information on this website or its suitability for you, please contact your financial or tax adviser, or an independent financial or tax adviser before making any investment or financial decisions.
The information provided on this website is not intended for distribution to, or use by, any person or entity in any jurisdiction or country where such distribution or use would be contrary to law or regulation or which would subject Kepler Partners LLP to any registration requirement within such jurisdiction or country. Persons who access this information are required to inform themselves and to comply with any such restrictions. In particular, this website is exclusively for non-US Persons. The information in this website is not for distribution to and does not constitute an offer to sell or the solicitation of any offer to buy any securities in the United States of America to or for the benefit of US Persons.
This is a marketing document, should be considered non-independent research and is subject to the rules in COBS 12.3 relating to such research. It has not been prepared in accordance with legal requirements designed to promote the independence of investment research.
No representation or warranty, express or implied, is given by any person as to the accuracy or completeness of the information and no responsibility or liability is accepted for the accuracy or sufficiency of any of the information, for any errors, omissions or misstatements, negligent or otherwise. Any views and opinions, whilst given in good faith, are subject to change without notice.
This is not an official confirmation of terms and is not to be taken as advice to take any action in relation to any investment mentioned herein. Any prices or quotations contained herein are indicative only.
Kepler Partners LLP (including its partners, employees and representatives) or a connected person may have positions in or options on the securities detailed in this report, and may buy, sell or offer to purchase or sell such securities from time to time, but will at all times be subject to restrictions imposed by the firm's internal rules. A copy of the firm's conflict of interest policy is available on request.
Past performance is not necessarily a guide to the future. The value of investments can fall as well as rise and you may get back less than you invested when you decide to sell your investments. It is strongly recommended that Independent financial advice should be taken before entering into any financial transaction.
PLEASE SEE ALSO OUR TERMS AND CONDITIONS
Kepler Partners LLP is a limited liability partnership registered in England and Wales at 9/10 Savile Row, London W1S 3PF with registered number OC334771.
Kepler Partners LLP is authorised and regulated by the Financial Conduct Authority.
Kepler Partners is a third-party supplier and not part of interactive investor. Neither Kepler Partners or interactive investor will be responsible for any losses that may be incurred as a result of a trading idea.
These articles are provided for information purposes only. Occasionally, an opinion about whether to buy or sell a specific investment may be provided by third parties. The content is not intended to be a personal recommendation to buy or sell any financial instrument or product, or to adopt any investment strategy as it is not provided based on an assessment of your investing knowledge and experience, your financial situation or your investment objectives. The value of your investments, and the income derived from them, may go down as well as up. You may not get back all the money that you invest. The investments referred to in this article may not be suitable for all investors, and if in doubt, an investor should seek advice from a qualified investment adviser.
Full performance can be found on the company or index summary page on the interactive investor website. Simply click on the company's or index name highlighted in the article.
Important Information
Kepler Partners is not authorised to make recommendations to Retail Clients. This report is based on factual information only, and is solely for information purposes only and any views contained in it must not be construed as investment or tax advice or a recommendation to buy, sell or take any action in relation to any investment.
This report has been issued by Kepler Partners LLP solely for information purposes only and the views contained in it must not be construed as investment or tax advice or a recommendation to buy, sell or take any action in relation to any investment. If you are unclear about any of the information on this website or its suitability for you, please contact your financial or tax adviser, or an independent financial or tax adviser before making any investment or financial decisions.
The information provided on this website is not intended for distribution to, or use by, any person or entity in any jurisdiction or country where such distribution or use would be contrary to law or regulation or which would subject Kepler Partners LLP to any registration requirement within such jurisdiction or country. Persons who access this information are required to inform themselves and to comply with any such restrictions. In particular, this website is exclusively for non-US Persons. The information in this website is not for distribution to and does not constitute an offer to sell or the solicitation of any offer to buy any securities in the United States of America to or for the benefit of US Persons.
This is a marketing document, should be considered non-independent research and is subject to the rules in COBS 12.3 relating to such research. It has not been prepared in accordance with legal requirements designed to promote the independence of investment research.
No representation or warranty, express or implied, is given by any person as to the accuracy or completeness of the information and no responsibility or liability is accepted for the accuracy or sufficiency of any of the information, for any errors, omissions or misstatements, negligent or otherwise. Any views and opinions, whilst given in good faith, are subject to change without notice.
This is not an official confirmation of terms and is not to be taken as advice to take any action in relation to any investment mentioned herein. Any prices or quotations contained herein are indicative only.
Kepler Partners LLP (including its partners, employees and representatives) or a connected person may have positions in or options on the securities detailed in this report, and may buy, sell or offer to purchase or sell such securities from time to time, but will at all times be subject to restrictions imposed by the firm's internal rules. A copy of the firm's conflict of interest policy is available on request.
Past performance is not necessarily a guide to the future. The value of investments can fall as well as rise and you may get back less than you invested when you decide to sell your investments. It is strongly recommended that Independent financial advice should be taken before entering into any financial transaction.
PLEASE SEE ALSO OUR TERMS AND CONDITIONS
Kepler Partners LLP is a limited liability partnership registered in England and Wales at 9/10 Savile Row, London W1S 3PF with registered number OC334771.
Kepler Partners LLP is authorised and regulated by the Financial Conduct Authority.
These articles are provided for information purposes only. Occasionally, an opinion about whether to buy or sell a specific investment may be provided by third parties. The content is not intended to be a personal recommendation to buy or sell any financial instrument or product, or to adopt any investment strategy as it is not provided based on an assessment of your investing knowledge and experience, your financial situation or your investment objectives. The value of your investments, and the income derived from them, may go down as well as up. You may not get back all the money that you invest. The investments referred to in this article may not be suitable for all investors, and if in doubt, an investor should seek advice from a qualified investment adviser.
Full performance can be found on the company or index summary page on the interactive investor website. Simply click on the company's or index name highlighted in the article.