Oil sector outlook for 2019
15th January 2019 13:11
by Rajan Dhall from interactive investor
Financial markets analyst Rajan Dhall explains the current scenario for oil markets and discusses where crude prices might be heading this year.

Oil markets have begun to recover again following more issues of oversupply in late 2018 that drove crude prices down as low as $40.20 per barrel.
A meeting of Saudi Arabia and other OPEC+ nations to cut 1.2 million barrels per day of production disappointed the market, although prices are higher since - Brent Crude oil trades at $59.52 per barrel and West Texas Intermediate (WTI) at $50.84 on the spot markets.
Saudi Arabia says it is willing to do whatever it takes to rebalance the market and has gone over and above the cuts. We heard yesterday from Saudi Oil Minister Al Falih who said there was no need for an extraordinary meeting before April. At the event in Abu Dhabi, he went on to state that the oil market was moving in the right direction and prices would recover soon.
There is always a conflict and balance between Russia and Saudi Arabia. From week to week we seem to get new production statistics, but Saudi is no longer the world’s largest producer as America have taken over. One very positive piece of news is the cost of production from Saudi Arabia was quoted as being $4 per barrel last week, so the margins are still there.
The global economic slowdown has also caused concerns recently. The trade spat between the world’s largest economies China and America has dampened global growth and commodities have suffered.
There has also been a period in which the US dollar strengthened significantly and, since December, we have seen a slight pullback. Chinese growth figures and data have begun to ease and commodities including copper and base metals have felt the pinch.
These are some key events to watch closely over the next few months:
7-8 February: OPEC officials are set to discuss the framework, and representatives from their non-OPEC partners will follow-up the consultations on February 18 to 19th to confirm arrangements.
17-18 March: OPEC and its allies plan to assess their oil-production accord in Azerbaijan
17-18 April: Ministers meet in Vienna to decide whether cutbacks should be extended beyond the summer timeline.
Chart analysis
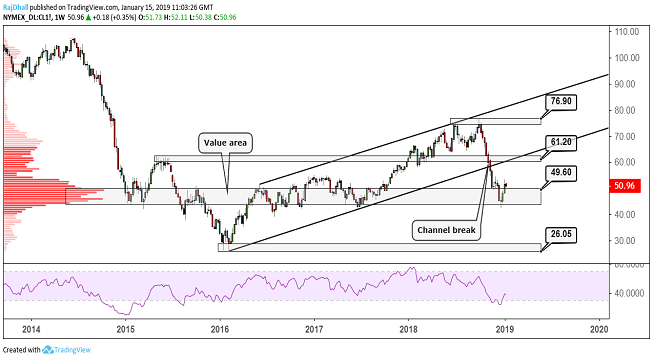
Looking at the current WTI futures chart, we can see a small turnaround underway.
Prices are now at what you could call a median level; the value area represented by the bell curve on the left of the chart shows us the area in which the most contracts have been exchanged and also, in this case, the area in which price has spent the longest amount of time.
This can now be seen as a pivot area whereby bearish sentiment is required for a move below the $45-50 region. The outlook has improved recently, but the only way we get back to the multi-year highs of $76.90 is if global sentiment improves or further sanctions and tension affect the Middle East.
There is also potential resistance in the $61.20 area where a rally failed back in 2015. It is also a region that includes the lower tramline of the uptrend from 2016, which might cause a stumble.
It's clear that US president Trump wants lower oil prices if his twitter rants are anything to go by. The Department of Energy and American Petroleum Institute figures must also be watched for clues as to the situation across the pond.

Source: TradingView (*) Past performance is not a guide to future performance
These articles are provided for information purposes only. Occasionally, an opinion about whether to buy or sell a specific investment may be provided by third parties. The content is not intended to be a personal recommendation to buy or sell any financial instrument or product, or to adopt any investment strategy as it is not provided based on an assessment of your investing knowledge and experience, your financial situation or your investment objectives. The value of your investments, and the income derived from them, may go down as well as up. You may not get back all the money that you invest. The investments referred to in this article may not be suitable for all investors, and if in doubt, an investor should seek advice from a qualified investment adviser.
Full performance can be found on the company or index summary page on the interactive investor website. Simply click on the company's or index name highlighted in the article.