Should investors swap shares for alternatives?
6th May 2022 14:00
Given that bonds are unattractive at the moment, Kepler considers whether equities can still offer investors meaningful diversification.

This content is provided by Kepler Trust Intelligence, an investment trust focused website for private and professional investors. Kepler Trust Intelligence is a third-party supplier and not part of interactive investor. It is provided for information only and does not constitute a personal recommendation.
Material produced by Kepler Trust Intelligence should be considered a marketing communication, and is not independent research.
Given none of us can see the future, diversification is a key tool in our armoury when it comes to building an investment portfolio. It would be bold, if not reckless, to own a series of investments that all require the same conditions to succeed.
Traditionally, there are two major sources of diversification for the average equity investor: bonds and overseas equities. The issues with the stock/bond correlation are well covered (and we touched on ourselves in recent strategy articles here and here). Unfortunately for investors, there are serious problems with using overseas equities to diversify too.
Below, we discuss new research showing that the correlation between major stock markets has risen decade on decade and ask what the options are for investors in the future.
Correlations have risen markedly
New research published by the CFA Institute has explored the correlations between major stock market indices over the past forty years. Those covered include a mix of developed and emerging market countries: the US, the UK, Germany, France, Japan, Hong Kong, China, Canada, Brazil, Russia, South Korea, India, Australia and Mexico.
In the 1980s, there was reasonable diversification on offer. The median correlation amongst the 45 pairs for which there was data was 0.25. Eight of the correlation pairs were negative (18%), with the lowest being that of the Brazilian and Hong Kong markets, which was -0.51. Unsurprisingly the FTSE 250 and the S&P 500 were the pair with the highest correlation of 0.83.
The Indian and Brazilian markets were involved in the most negatively correlated pairs. The FTSE 250 had a negative correlation to both countries’ markets, while the French CAC 40 also displayed a low correlation of 0.37 to the UK.
In the 1990s, the median correlation rose slightly to 0.3. Of the 91 pairs, only seven were negative, or 7.7%, with three of these involving India. The correlation of the Indian market to the UK was positive but very low at 0.07, giving strong diversification. The Brazilian market’s correlation was just 0.08.
In the 2000-2010 period, the average correlation took a real step up to 0.62, and there were no negative pairs. The Chinese market displayed a correlation to the FTSE 250 of 0.23, but this was the only pair involving the UK to be below 0.6. In the 2010s, the median slipped to 0.5, while the minimum was just 0.19. The market with the lowest correlation to the UK was Brazil’s, and this was as high as 0.35. The slight fall in the median was largely due to the fall in the correlations of emerging market indices to the developed market indices.
HISTORIC CORRELATIONS
| MIN | MAX | MEDIAN | MEAN | STD. DEV | |
| 1980s | -0.51 | 0.83 | 0.25 | 0.25 | 0.32 |
| 1990s | -0.12 | 0.83 | 0.3 | 0.31 | 0.24 |
| 2000s | 0.2 | 0.95 | 0.62 | 0.59 | 0.16 |
| 2010s | 0.19 | 0.87 | 0.5 | 0.51 | 0.14 |
| 2020s* | 0.37 | 0.93 | 0.72 | 0.7 | 0.14 |
Source: Hortstmeyer, McManus, Oliver, CFA Enterprising Investor Blog, *incomplete period. Past performance is not a reliable indicator of future results.
Could these trends reverse?
The authors suggest globalisation could be behind the trend of rising correlations. If so, then this raises an intriguing possibility. The reshoring phenomenon and the current political fragmentation of the world economy are said to be leading to a deglobalisation trend. Should we then expect correlations between global stock markets to fall?
In reality, it seems the deglobalisation trend we are seeing is largely regionalisation or splitting into geopolitical trade blocks. The key trend is cutting Russia and China out of the Western-led system, with the relationship between these two countries in the balance. Flows between the developed world and India, Latin America and Africa seem unlikely to be disrupted at this time, and in fact, ties could increase as alternatives to China and Russia are sought. If so, then it could be China’s development will be more endogenously driven in future, and its markets may offer greater diversification over the coming decade. Certain factors will limit its ability to shut itself off from the global system, such as its dependence on energy imports. However, key policy goals of the Chinese Communist Party are aimed at greater self-sufficiency. One strategic aim is to develop a higher value-add domestic technology sector in semiconductors and finished goods. Additionally, a key aim of the latest five-year plan (to 2025) is the equalising of standards of living within the country, which implies significant consumption growth, offering a source of revenue growth to domestic manufacturers even if the developed world imports less from China in the coming years. Furthermore, Xi’s policy of “dual circulation” is intended to increase the domestic cycle of production, distribution and consumption at the expense of external circulation via trade.
All this is no good if China offers “bad diversification”. A market which does poorly year after year will show low correlation if other markets are rallying. Chinese equities have been struggling this year, with lockdowns in Shanghai and Beijing causing economic chaos. While we would not want to try to call a bottom, valuations have become more attractive in the market, and the discounts of the specialist investment trusts are potentially interesting too. abrdn China (LSE:ACIC)is trading on a 12% discount at the time of writing. When we met with them recently, the managers told us they viewed the current market weakness as a good opportunity to buy quality companies. The opportunity is particularly rare for companies in the healthcare industry, they say, which they think has a strong outlook as China’s ageing population becomes wealthier. JPMorgan China Growth & Income (LSE:JCGI)is more focused on high growth than ACIC, which has a greater emphasis on steadier, high-quality earnings streams. JCGI also has substantial gearing, which means it would likely see greater returns in any recovery rally.
Another intriguing phenomenon which could see falling correlations in future is the reversal in the growth/value trend. Since the 2007/2008 financial crisis, value has steadily underperformed growth. This, in part, reflects the poor performance of banks in a much more regulated environment and a low-interest rate regime which was poor for volatility. It also reflected a cooling off in commodity markets as China’s rapid growth slowed and spare capacity was mothballed. The decline in the value of banks, energy producers and commodity producers in the developed world has led to their decline as major positions in those stock markets. If we see a period of sustained high commodity prices, which is one consequence of the trade tensions we are seeing, particularly the excision of Russia from the global economy, then countries which have high weightings to the sectors in their markets could outperform while growth-heavy stock markets tail off under the weight of rising interest rates. We have seen this in 2022 so far, with resource-heavy Brazil and Canada both performing well as global markets have sunk. It is conceivable that this trend could be a multi-year one, in which an allocation to Brazil could prove a useful diversifier to the growth-heavy S&P 500.
The only option for investment trust investors looking for exposure to the Latin American equity markets (without fixed income exposure mixed in) isBlackRock Latin American (LSE:BRLA). BRLA’s portfolio typically has a high allocation to commodity producers, reflecting the makeup of the region’s markets. This, along with the exposure to energy and banks, means the region and the portfolio are typically more exposed to the value factor. This brings with it diversification value versus global bonds, which might prove attractive in the current rising interest rate environment. Commodity producers also bring exposure to some secular themes in the energy transition.
Is geographical diversification dead?
Another feature of this regionalisation trend we are seeing is the attempt to bind India further into the Western system. This has strong political imperatives as well as economic. If cross-border capital flows into India are to increase, their influence on the economy will increase and the correlation of India to world markets could rise. The same could be said for any of the other winners of the shift of trade away from China and Russia. If we are right that the deglobalisation trend really is just about shutting Russia and China out, then there is no obvious reason to expect the correlation between the other markets to decline, and emerging markets ex-China and Russia could see their correlation with global markets rise. We suggest relying on single country China and Brazil funds to diversify a global equity portfolio is unlikely to be optimal or wise! Overall we still think macro trends support a trend towards greater correlation in global equity markets.
If this is true, and if bonds are unattractive at the moment for diversification, then the best option for investors is likely to be alternatives. A further reason for allocating to alternatives is the tendency for the correlations of equity markets to rise in a time of crisis. The figures we have been considering above are calculated over a decade. Within this period, correlations can be much higher over the short term. In fact, a spike in correlation was seen during the pandemic as the global challenge hit all markets at the same time, with global trade and capital flows seizing up. We illustrate this below with the chart of the one-year correlation between the FTSE 250 and the market with which it had the lowest correlation, Brazil. During 2012-13 and again during 2020, the markets had a very high correlation, mirroring a general rise in correlations across markets during these periods. We have included the correlation of Brazil versus global equities and the FTSE 250 versus global equities to highlight the same pattern of rising correlations at the time of global stress.
ONE-YEAR ROLLING CORRELATION
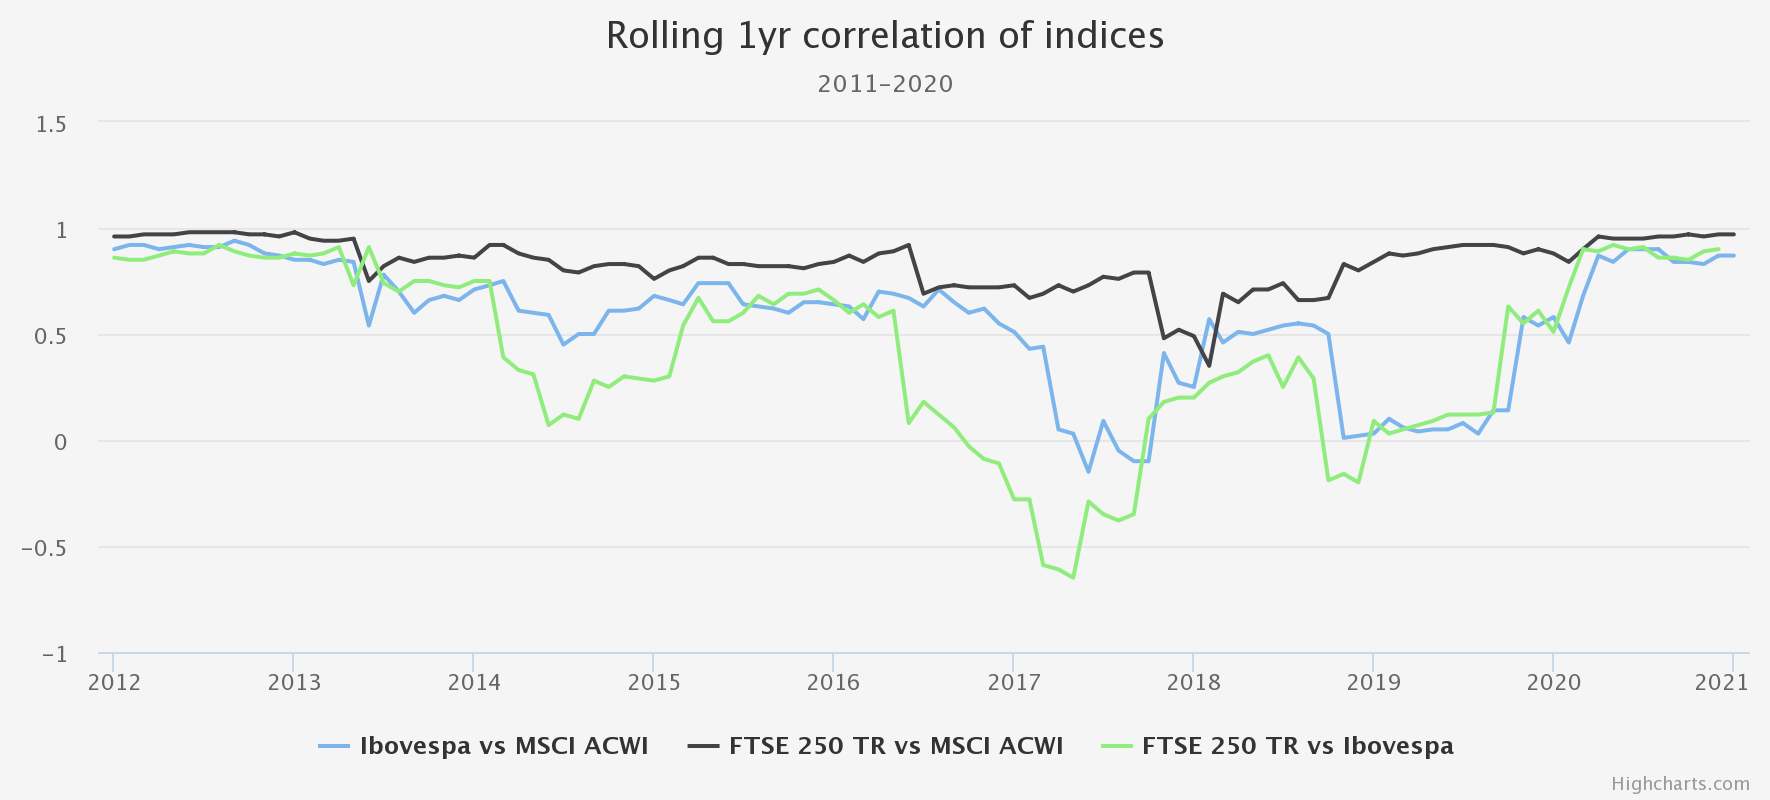
Source: Morningstar. Past performance is not a reliable indicator of future results.
For this reason, we think the higher correlation seen in the 2020 – 2022 period highlighted by the CFA Institute research above can’t be read as indicating correlations will rise on a sustained basis – it may just reflect the impact of the pandemic. However, this phenomenon does highlight the need for asset diversification in a time of crisis.
In the research cited above, the median correlation between equity markets over the past two decades has been over 0.5, with the correlation spiking to 0.8-0.9 in times of crisis. There are few alternative trusts with a track record long enough to compare. As a result, we have focused on the two periods of higher correlations identified above: 2012/2013 and 2019 onwards. Ten of the 19 alternative trusts we have identified as being around during 2012-2013 are property trusts. Even so, the median correlation of their share prices with the MCI ACWI during this period was just 0.44. We chose share price as the NAVs are largely not derived from market pricing and are typically only reported every month or quarter, so using share price makes the test harder. Even so, the trusts did a decent job of diversifying on a purely quantitative basis. One trust which stands out is HICL Infrastructure (LSE:HICL), whose share price correlation to equities was just 0.2 during this period. HICL is invested in core infrastructure assets, the majority of which are PPP and regulated assets, giving highly secure income streams. The trust also has good inflation linkage: the managers estimate the pass-through of RPI to income received is as high as 0.8.
During the second period, 2019-2022, the median correlation was higher at 0.59. However, the number of trusts exploded to 63, reflecting the scale of demand for alternatives. Greencoat Renewables had one of the lowest correlations, at 0.25. Interestingly, a number of generalist commercial property trusts also displayed low correlation: Standard Life Property Income, BMO Real Estate Investments (LSE:BREI)and UK Commercial Property REIT (LSE:UKCM)all had correlations below 0.34. This might be surprising to some as commercial property has some economic sensitivity which could increase the correlation to equities. In our view, this is due to the fact the sector has been dealing with and recovering from sector-specific issues relating to the lockdowns, doubts about the viability of property after the pandemic and the restoration of dividends which were cut during the first lockdown. Sectors which are driven by their own specific dynamics should, in theory, offer greater diversification, and we think this situation may continue for property in the coming months and years. Valuations suffered during the pandemic, but in recent quarters trusts have reported strong NAVs and raised dividends back close to or at pre-pandemic levels. There is also good inflation linkage in the sector, either explicit or implicit. We think NAVs could be relatively resilient in the near future, with share prices potentially strong as the market comes around.
Conclusions
The rise in correlations between global equity markets in recent decades seems quite likely to reflect the impact of globalisation. A rise in cross-border flows of capital and a fall in tariffs and trade barriers have likely contributed to economies and stock markets, which move more closely together. We don’t think this process is likely to reverse wholesale, although the increasing self-sufficiency of the Chinese market may see some uncoupling. Additionally, markets in the short to medium term may be driven by a revaluation of commodities versus growth stocks, which could see some divergent returns from markets with very different underlying exposures. However, the diversification benefit of low correlation is likely to remain hard to come by from equity markets in the coming years, meaning alternatives are likely to play a role for many investors. This year we are running a series of articles highlighting what alternatives can provide to a portfolio under the Private Markets heading, including infrastructure and renewables and private debt. Next month we will continue the series with a look at commercial property, an unloved sector which we think has much to offer.
Kepler Partners is a third-party supplier and not part of interactive investor. Neither Kepler Partners or interactive investor will be responsible for any losses that may be incurred as a result of a trading idea.
These articles are provided for information purposes only. Occasionally, an opinion about whether to buy or sell a specific investment may be provided by third parties. The content is not intended to be a personal recommendation to buy or sell any financial instrument or product, or to adopt any investment strategy as it is not provided based on an assessment of your investing knowledge and experience, your financial situation or your investment objectives. The value of your investments, and the income derived from them, may go down as well as up. You may not get back all the money that you invest. The investments referred to in this article may not be suitable for all investors, and if in doubt, an investor should seek advice from a qualified investment adviser.
Full performance can be found on the company or index summary page on the interactive investor website. Simply click on the company's or index name highlighted in the article.
Important Information
Kepler Partners is not authorised to make recommendations to Retail Clients. This report is based on factual information only, and is solely for information purposes only and any views contained in it must not be construed as investment or tax advice or a recommendation to buy, sell or take any action in relation to any investment.
This report has been issued by Kepler Partners LLP solely for information purposes only and the views contained in it must not be construed as investment or tax advice or a recommendation to buy, sell or take any action in relation to any investment. If you are unclear about any of the information on this website or its suitability for you, please contact your financial or tax adviser, or an independent financial or tax adviser before making any investment or financial decisions.
The information provided on this website is not intended for distribution to, or use by, any person or entity in any jurisdiction or country where such distribution or use would be contrary to law or regulation or which would subject Kepler Partners LLP to any registration requirement within such jurisdiction or country. Persons who access this information are required to inform themselves and to comply with any such restrictions. In particular, this website is exclusively for non-US Persons. The information in this website is not for distribution to and does not constitute an offer to sell or the solicitation of any offer to buy any securities in the United States of America to or for the benefit of US Persons.
This is a marketing document, should be considered non-independent research and is subject to the rules in COBS 12.3 relating to such research. It has not been prepared in accordance with legal requirements designed to promote the independence of investment research.
No representation or warranty, express or implied, is given by any person as to the accuracy or completeness of the information and no responsibility or liability is accepted for the accuracy or sufficiency of any of the information, for any errors, omissions or misstatements, negligent or otherwise. Any views and opinions, whilst given in good faith, are subject to change without notice.
This is not an official confirmation of terms and is not to be taken as advice to take any action in relation to any investment mentioned herein. Any prices or quotations contained herein are indicative only.
Kepler Partners LLP (including its partners, employees and representatives) or a connected person may have positions in or options on the securities detailed in this report, and may buy, sell or offer to purchase or sell such securities from time to time, but will at all times be subject to restrictions imposed by the firm's internal rules. A copy of the firm's conflict of interest policy is available on request.
Past performance is not necessarily a guide to the future. The value of investments can fall as well as rise and you may get back less than you invested when you decide to sell your investments. It is strongly recommended that Independent financial advice should be taken before entering into any financial transaction.
PLEASE SEE ALSO OUR TERMS AND CONDITIONS
Kepler Partners LLP is a limited liability partnership registered in England and Wales at 9/10 Savile Row, London W1S 3PF with registered number OC334771.
Kepler Partners LLP is authorised and regulated by the Financial Conduct Authority.