Stockwatch: is this the next candidate for big takeover premium?
His tip returned 85% in just four months following a knockout takeover offer. Now, analyst Edmond Jackson assesses the odds of another big bid for this UK peer.
16th May 2025 09:11
by Edmond Jackson from interactive investor

Does a recommended takeover for H&T Group (LSE:HAT), the UK’s largest pawnbroker, at nearly 90% higher than its share price last January, imply that peer Ramsdens Holdings (LSE:RFX) is likewise misvalued by the market?
I have drawn attention variously to AIM-listed H&T as a “buy” over years, although sometimes, and despite a sound business model of combining gold trading and jewellery sales, its shares have been fickle. From end-2018 at 260p, all it operations were successful, and a well-managed pawnbroker seemed an appropriate core business for a difficult consumer environment in the post-Brexit economy.
- Invest with ii: Open a Stocks & Shares ISA | ISA Investment Ideas | Transfer a Stocks & Shares ISA
H&T shares rose to 400p by September 2019, then suffered Covid disruption before testing 500p in 2022. Yet the price fell through 2023 and 2024 such that in January at a two-year low, I suggested "buy" at 350p on the basis H&T could have a favourable year amid consumer pressures. The shares still dropped as low as 334p in February:
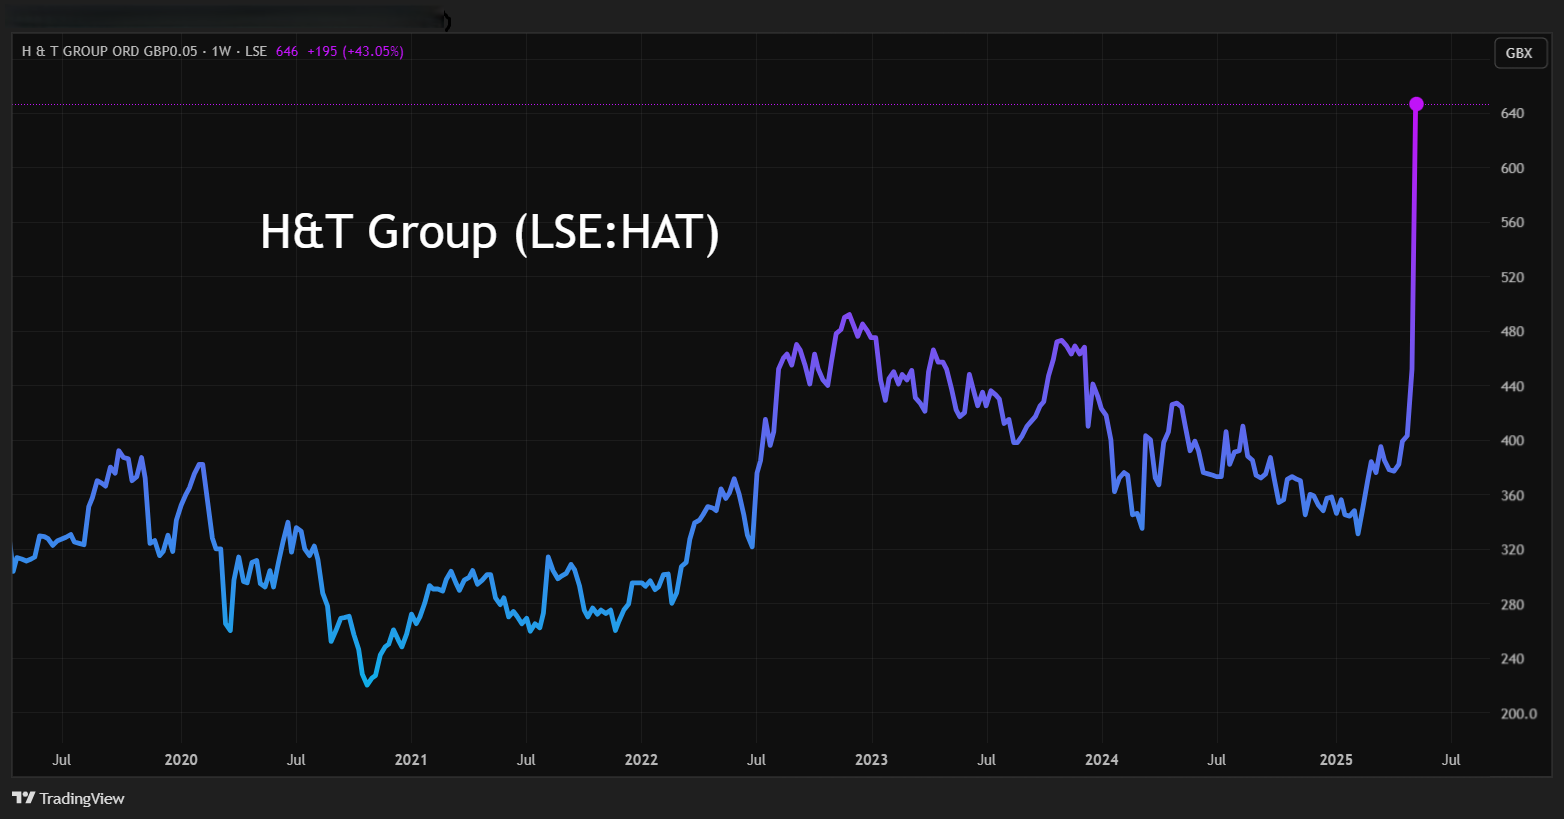
Source: TradingView. Past performance is not a guide to future performance.
With another US corporate buyer exploiting fickle pricing of UK equities – especially in small cap – it is possible to empathise with the H&T board recommending a 650p cash per share offer plus an 11p final dividend from America’s FirstCash Holdings Inc (NASDAQ:FCFS). Despite this only representing a price/earnings (PE) multiple of 12x consensus earnings per share this year, the PE has typically only been in high single figures.
By comparison, FirstCash trades on a forward PE of 15.5x as a near £4 billion equivalent company, although it may be that its size and a US perspective on valuation has been supportive:
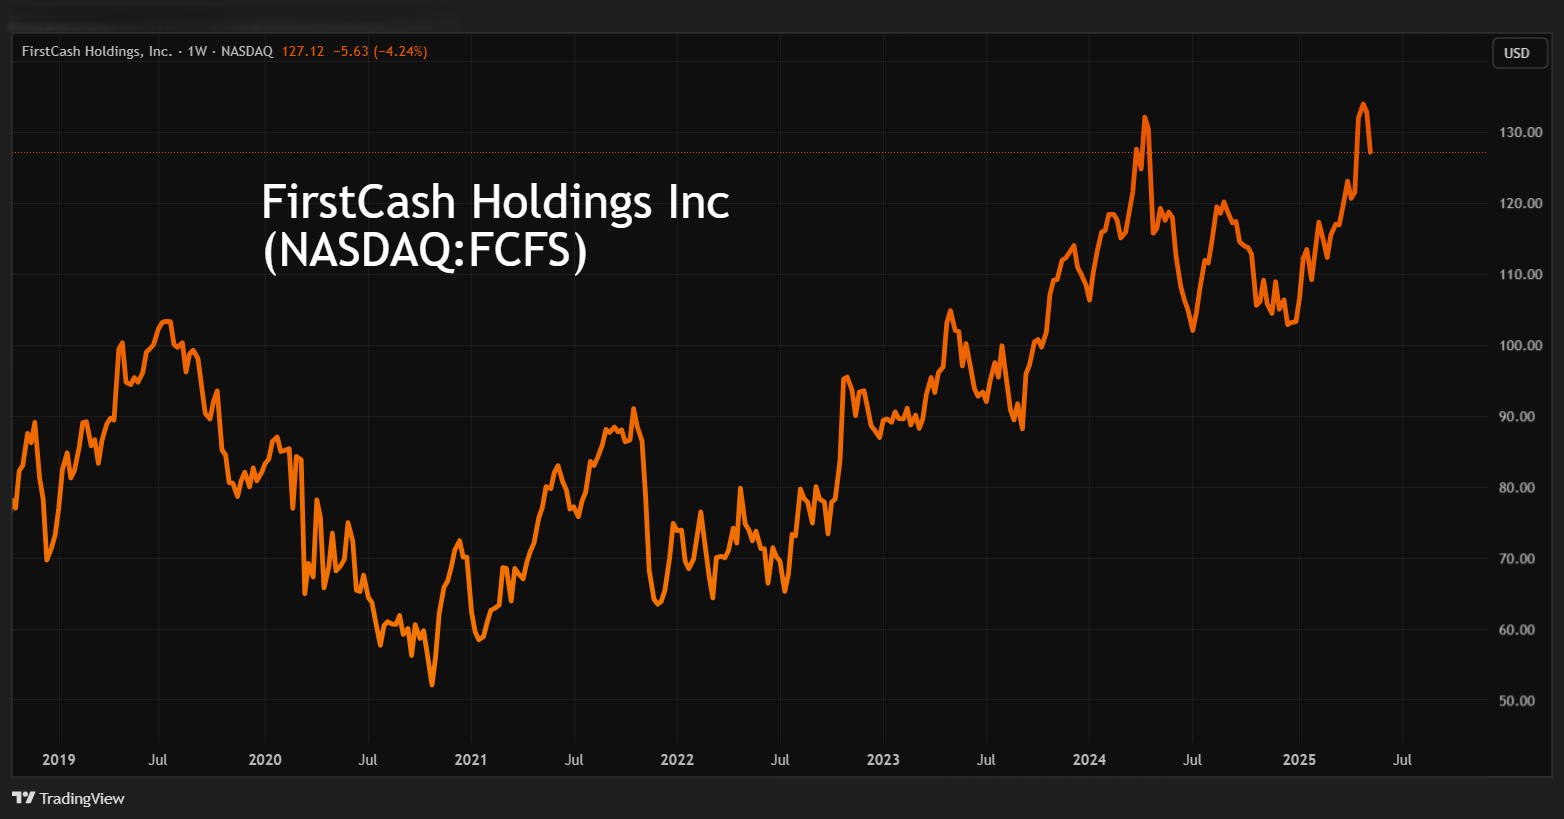
Source: TradingView. Past performance is not a guide to future performance.
Having expanded successfully in the US and Latin America, FirstCash will by this takeover gain market leadership in the UK, perhaps as a springboard next into Europe. Indeed, this acquisition is “financially compelling”; the PE differentiation alone means it is virtually guaranteed to be earnings-enhancing for FirstCash.
It reminds us how UK companies are takeover targets as US business sentiment recovers, although negotiations here have been underway for six months, hence it’s surprising there was no prior disclosure of the approach. Despite gloom over Labour government policy, yesterday heralded better-than-expected news on first quarter UK economic output, raising the odds that after a possible slowing in the second quarter, growth will resume henceforth.
- Cheap shares make UK a profitable market in an age of détente
- Sign up to our free newsletter for investment ideas, latest news and award-winning analysis
With hindsight, H&T was always exposed – as the UK market leader – for classic absorption into the US corporate fold. The market has serially fretted about how gold price volatility and lately cost pressures from employment taxes and legislation, might compromise growth. Yet notwithstanding disruption from Covid, the financial track record has been respectable: reported operating margins recovered over 13% and the company is on course to quadruple its dividend from 2019:
| H&T Group - financial summary | |||||||||||
| year ended 31 Dec | 2014 | 2015 | 2016 | 2017 | 2018 | 2019 | 2020 | 2021 | 2022 | 2023 | 2024 |
| Turnover (£ million) | 87.7 | 89.2 | 94.2 | 125 | 143 | 160 | 129 | 122 | 174 | 221 | 265 |
| Operating margin (%) | 7.1 | 8.4 | 10.6 | 10.0 | 11.4 | 14.0 | 13.1 | 7.5 | 11.8 | 13.4 | 13.4 |
| Operating profit (£m) | 6.2 | 7.5 | 10.2 | 12.5 | 16.2 | 22.5 | 16.9 | 9.1 | 20.6 | 29.5 | 35.5 |
| Net profit (£m) | 4.3 | 5.4 | 7.6 | 9.5 | 11.0 | 16.7 | 12.6 | 6.0 | 14.9 | 21.1 | 22.2 |
| Reported earnings/share (p) | 11.8 | 14.9 | 20.9 | 25.9 | 29.6 | 43.8 | 32.1 | 15.4 | 37.1 | 48.5 | 50.9 |
| Normalised earnings/share (p) | 17.5 | 14.9 | 21.4 | 25.9 | 85.4 | 89.3 | 46.4 | 31.0 | 59.6 | 85.3 | 109.0 |
| Operating cashflow/share (p) | 39.8 | 31.0 | 3.6 | -9.5 | 19.4 | 67.8 | 141 | -7.8 | -33.0 | -8.1 | 27.2 |
| Capex/share (p) | 3.1 | 3.3 | 5.3 | 4.8 | 9.1 | 23.4 | 15.8 | 24.2 | 35.0 | 19.8 | 16.7 |
| Free cashflow/share (p) | 36.7 | 27.7 | -1.7 | -14.3 | 10.3 | 44.4 | 126 | -32.0 | -68.0 | -27.8 | 19.5 |
| Dividend per share (p) | 4.8 | 7.6 | 9.2 | 10.5 | 11.0 | 4.7 | 8.5 | 12.0 | 15.0 | 17.0 | 18.0 |
| Covered by earnings (x) | 2.5 | 2.0 | 2.3 | 2.5 | 2.7 | 9.3 | 3.8 | 1.3 | 2.5 | 2.9 | 2.8 |
| Return on total capital (%) | 8.9 | 10.1 | 10.6 | 13.2 | 11.0 | 5.8 | 10.4 | 12.3 | 12.8 | ||
| Cash (£m) | 9.6 | 8.7 | 11.4 | 12.0 | 34.5 | 17.6 | 12.2 | 11.4 | 14.7 | ||
| Net debt (£m) | 9.4 | 2.0 | 5.1 | 13.1 | 37.4 | 38.6 | -13.8 | 1.4 | 22.8 | 53.6 | 74.2 |
| Net asset value/share (p) | 247 | 255 | 267 | 266 | 276 | 309 | 338 | 343 | 374 | 403 | 437 |
Source: historic Company REFS and published accounts
Do similar considerations apply to Ramsdens Holdings?
Yesterday, Ramsdens’ AIM-listed shares rose 4% to around 300p, capitalising the group at near £97 million compared with £190 million for H&T before its takeover was announced.
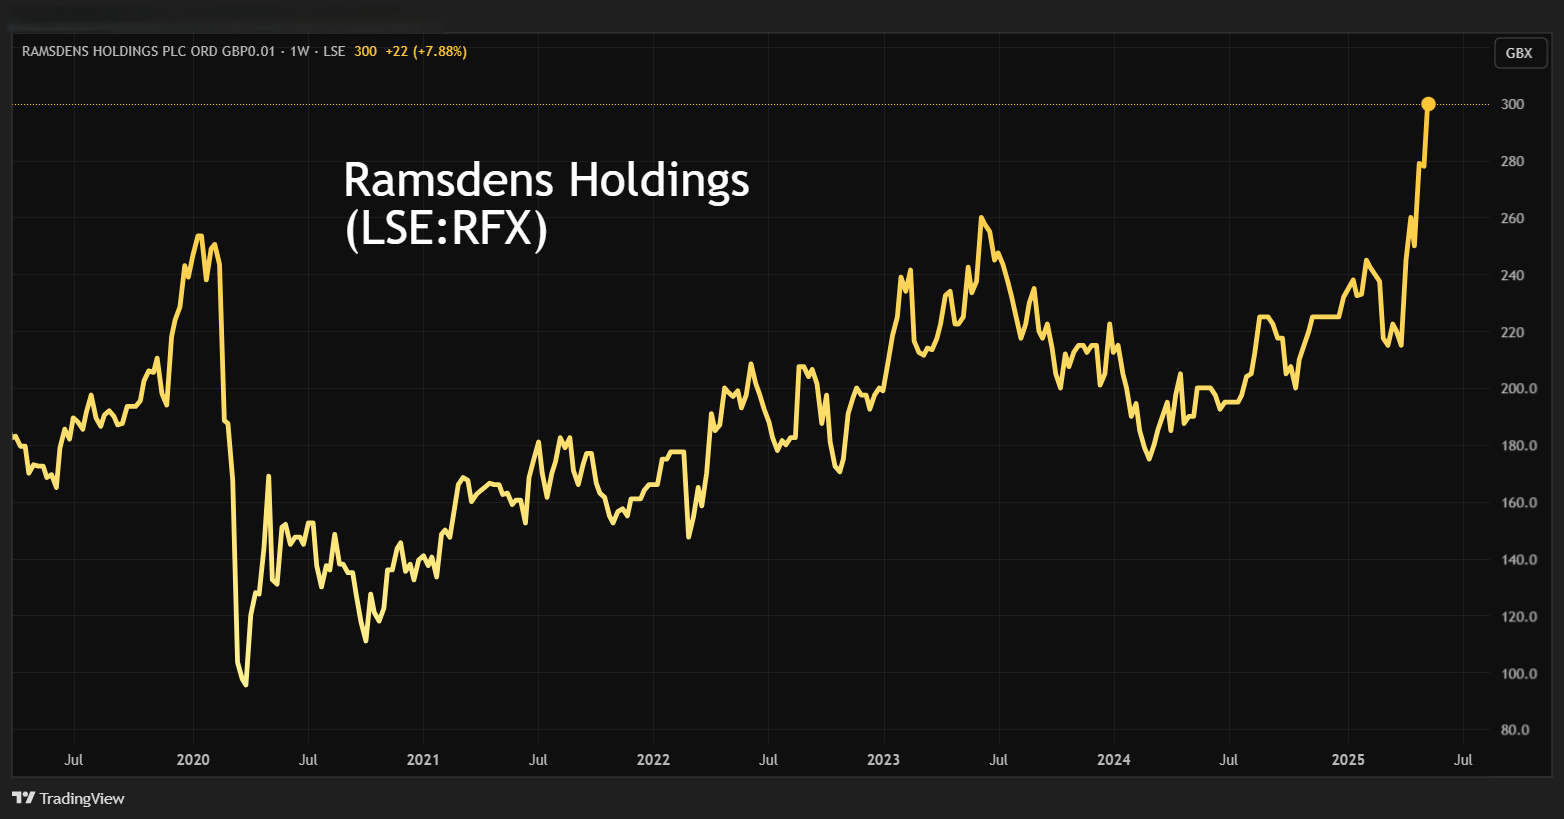
Source: TradingView. Past performance is not a guide to future performance.
Ramsdens is not the UK market leader like H&T but has a similar strategy of dove-tailing pawnbroking with gold trading, plus jewellery/watches and foreign currency.
A difference with the H&T takeover is FirstCash potentially being able to achieve synergies and the operations benefitting from investment by a new parent, factors which help justify paying over market price.
But FirstCash’s paying around 50% over market levels where H&T has recently traded, is a classic example of “worth to a private owner” versus the stock market, advocated by Benjamin Graham as the dean of 20th century value investing. It implies a recent valuation gap well beyond potential synergies plus a premium for control.
I am cautious to assume Ramsdens can end up a target, but H&T’s takeover implies comfort for holders of such shares on high single-digit PE’s and mid single-digit yields.
From Ramsdens’ financial record, we see near exact same 13% margins over the last three financial years, plus good dividend growth with over twice earnings cover. Despite this year’s 45% re-rate from 205p close to 300p, the prospective yield is around 4.5% as dividend expectations rise over 13p per share.
| Ramsdens Holdings - financial summary | ||||||
| Year end 30 Sep | 2019 | 2020 | 2021 | 2022 | 2023 | 2024 |
| Turnover (£ million) | 46.8 | 76.9 | 40.7 | 66.1 | 83.8 | 95.6 |
| Operating profit (£m) | 6.6 | 10.0 | 1.0 | 8.8 | 10.9 | 12.5 |
| Net profit (£m) | 5.2 | 7.1 | 0.4 | 6.6 | 7.8 | 8.3 |
| Operating margin (%) | 14.1 | 13.0 | 2.6 | 13.4 | 13.0 | 13.0 |
| Reported earnings/share (p) | 16.7 | 23.1 | 1.2 | 20.9 | 24.0 | 25.7 |
| Normalised earnings/share (p) | 16.9 | 15.7 | -1.8 | 20.9 | 24.0 | 25.7 |
| Operational cashflow/share (p) | 5.0 | 51.1 | 3.5 | 9.3 | 10.2 | 36.8 |
| Capital expenditure/share (p) | 12.7 | 6.6 | 5.3 | 9.0 | 8.4 | 8.0 |
| Free cashflow/share (p) | -7.7 | 44.5 | -1.8 | 0.3 | 1.8 | 28.8 |
| Dividend per share (p) | 7.2 | 2.7 | 1.2 | 9.0 | 10.4 | 11.2 |
| Covered by earnings (x) | 2.3 | 8.6 | 1.0 | 2.3 | 2.3 | 2.3 |
| Return on total capital (%) | 20.9 | 23.4 | 2.4 | 17.7 | 19.4 | 20.1 |
| Cash (£m) | 13.4 | 15.9 | 13.0 | 15.3 | 13.0 | 15.8 |
| Net debt (£m) | -8.2 | -6.8 | -4.4 | 1.1 | 5.1 | 2.3 |
| Net assets (£m) | 30.9 | 35.6 | 36.1 | 41.8 | 48.2 | 53.6 |
| Net assets per share (p) | 100 | 115 | 115 | 132 | 152 | 168 |
Source: company accounts
Whether symptomatic of market caution towards this type of business, consensus currently expects a flat earnings year to September 2026 after 15% or so growth in 2025, hence while the forward PE is just shy of 10x it means the PEG ratio (P/E divided by the expected earnings growth rate) is 1.8x when ideally you are looking for below 1.0. That however is very much a snapshot view, unsatisfactory as a business valuation, and amid high uncertainty it may simply be that analysts are non-committal for now. Understandably, it is very hard to say where gold prices – one key element of group revenue/profit – may be in a year or so.
An 8 April trading update in respect of Ramsdens’ half-year to 31 March, cited pre-tax profit of at least £13.0 million, up 14% and ahead of previous expectations, which momentum appears factored into the consensus forecasts to 30 September 2025.
Rising gold prices helped boost interim gross profit for gold buying by 50% like-for-like, together with a 5% increase in weight of gold bought. A dedicated gold-buying website was launched in March and is hoped to generate new custom. Much would seem to depend – for gold demand – on whether further twists happen in the global macro story. Has President Trump been persuaded to cool his rhetoric, or was a climb-down on trade tariffs always part of his plan, such that he may throw a fresh tantrum on something else to get attention and US “partners” on the defensive? The overall level of uncertainty and fear is key for gold demand.
An advantage I see in a pawnbroker type share – relative to physical buying of gold or an exchange-traded fund – is exposure to gold albeit with balanced risk, with the other operations mitigating near-term gold price volatility. This also obviously means Ramsdens may at times lag market action in gold, and you can never be sure if some part of the group might disappoint.
But the big advantage with such a share is proven investment criteria with an established dividend record, even if Ramsdens’ trading at nearly twice book value might not strictly constitute a “margin of safety”.
By contrast, gold’s value is highly speculative - there is no yield (unless say from mining shares) and price rests near-wholly on what the next buyer is prepared to pay.
So with H&T departing the market at a big premium, if gold prices do stay reasonably sustained then perhaps this virtue will sink into investors. Ramsdens could enjoy a scenario of gradually improving sentiment, potentially assisting its shares if the group’s numbers and narrative remain good.
10% growth in pawnbroking interim gross profit
Admittedly, growth is not sensational in the business with core appeal in this group for challenged times. It may also have benefited from a new website since last November.
The April update also cited jewellery retail gross profit rose 15% - despite scrapping some aged stock –showing how this aspect of the business may not trade inversely to pawnbroking. When consumer discretionary spending falls, people may buy more used jewellery and watches instead of new.
Foreign currency exchange gross profit was flat, possibly reflecting a saturated market and evolution of “fintech” rivals such as Revolut.
Ramsdens’ last operational profile thus affirms a relatively steady rather than sensational business group; this year at least, with financial momentum probably ahead of a PE around 10x. But a meaningful 4.5% yield twice covered is also reason to own it.
Overall factors thus tilt me to a “buy” stance ahead of interim results due 4 June.
Edmond Jackson is a freelance contributor and not a direct employee of interactive investor.
These articles are provided for information purposes only. Occasionally, an opinion about whether to buy or sell a specific investment may be provided by third parties. The content is not intended to be a personal recommendation to buy or sell any financial instrument or product, or to adopt any investment strategy as it is not provided based on an assessment of your investing knowledge and experience, your financial situation or your investment objectives. The value of your investments, and the income derived from them, may go down as well as up. You may not get back all the money that you invest. The investments referred to in this article may not be suitable for all investors, and if in doubt, an investor should seek advice from a qualified investment adviser.
Full performance can be found on the company or index summary page on the interactive investor website. Simply click on the company's or index name highlighted in the article.
Disclosure
We use a combination of fundamental and technical analysis in forming our view as to the valuation and prospects of an investment. Where relevant we have set out those particular matters we think are important in the above article, but further detail can be found here.
Please note that our article on this investment should not be considered to be a regular publication.
Details of all recommendations issued by ii during the previous 12-month period can be found here.
ii adheres to a strict code of conduct. Contributors may hold shares or have other interests in companies included in these portfolios, which could create a conflict of interests. Contributors intending to write about any financial instruments in which they have an interest are required to disclose such interest to ii and in the article itself. ii will at all times consider whether such interest impairs the objectivity of the recommendation.
In addition, individuals involved in the production of investment articles are subject to a personal account dealing restriction, which prevents them from placing a transaction in the specified instrument(s) for a period before and for five working days after such publication. This is to avoid personal interests conflicting with the interests of the recipients of those investment articles.