A tale of two halves in this investment trust sector
5th August 2022 14:03
In listed private equity, growth capital and buyout trusts are trading at wide discounts. Kepler examines where bargain-hunters should focus.

This content is provided by Kepler Trust Intelligence, an investment trust focused website for private and professional investors. Kepler Trust Intelligence is a third-party supplier and not part of interactive investor. It is provided for information only and does not constitute a personal recommendation.
Material produced by Kepler Trust Intelligence should be considered a marketing communication, and is not independent research.
The past year has seen a significant shift in risk appetites from investors. Examples abound, but within investment trusts this has been reflected by a general widening of discounts.
At the start of the year, according to Morningstar statistics, the weighted average discount for the sector (excluding 3i and VCTs) was 1.2%, which has widened dramatically to 7.3%. In some cases this may be entirely justified, but in others it perhaps looks overdone.
One of the biggest swings has been listed private equity where discounts for both growth capital trusts and more established private equity trusts have widened significantly, as we illustrate in the graph below.
SECTOR DISCOUNTS
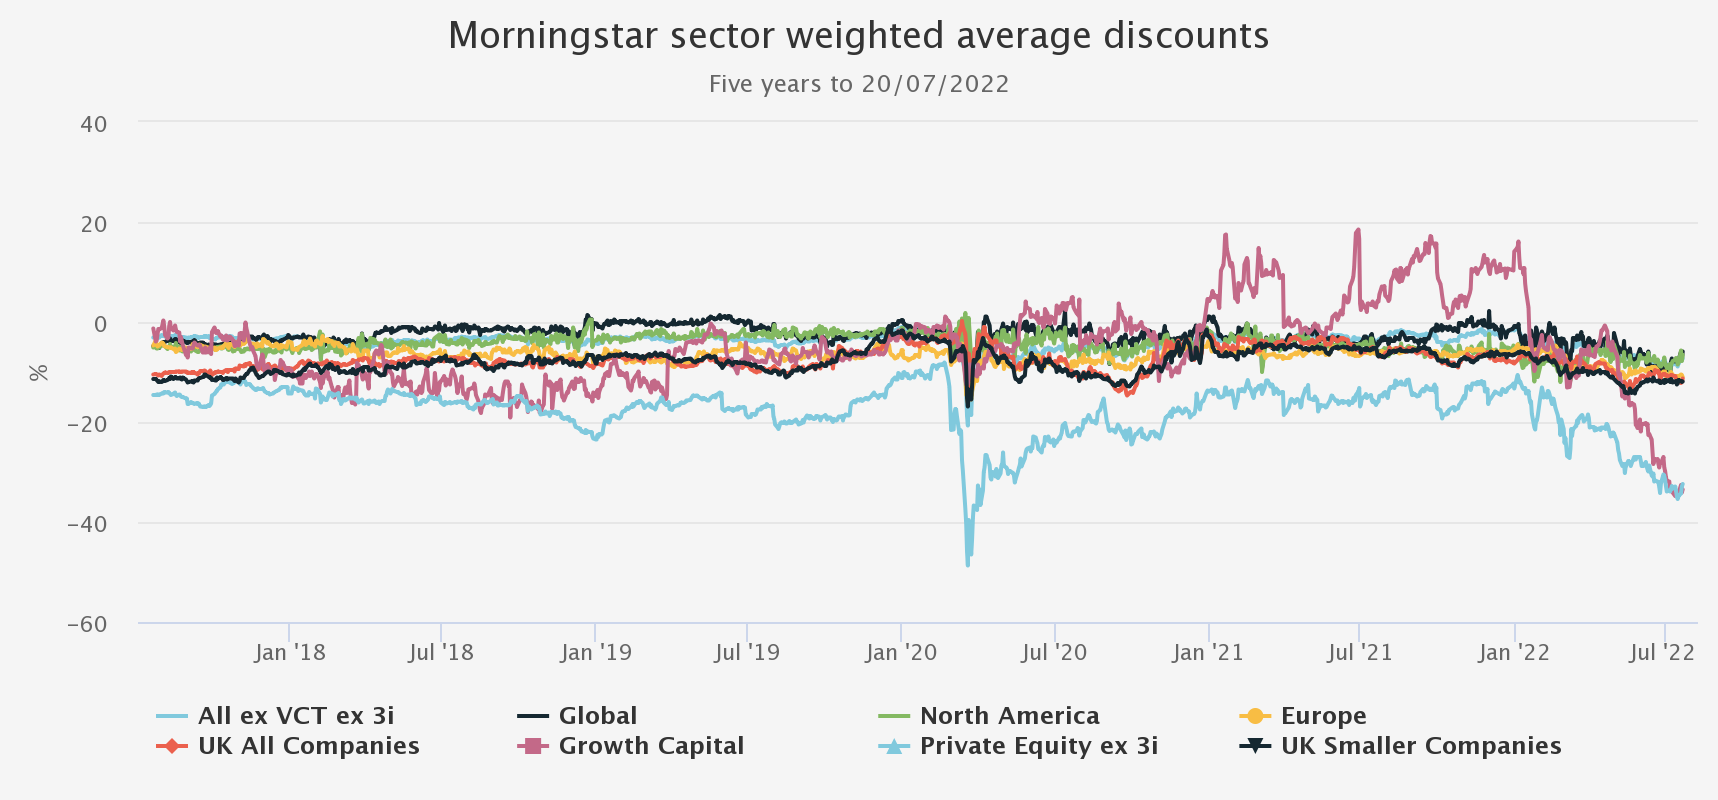
Source: Morningstar. Past performance is not a reliable indicator of future results
Traditional private equity trusts (largely exposed to buyouts, either directly or through funds) have seen average discounts widen by over 20%. However, within the newer growth capital sub-category, discounts have widened by 40%, although in some cases the move has been even more extreme.
In some cases, shareholder pain has been exacerbated by trusts (such as Chrysalis (LSE:CHRY)and Schiehallion (LSE:MNTN)) having previously traded on hefty premiums of close to 20% only 12 months ago. Now both groups of trusts find themselves trading on similar discounts of around 40%, admittedly to historic NAVs.
The shift in sentiment and discounts widening should serve as a reminder that however exciting or unique an investment proposition is, anything more than a modest premium to NAV can often lead to tears before bedtime.
AVERAGE DISCOUNTS
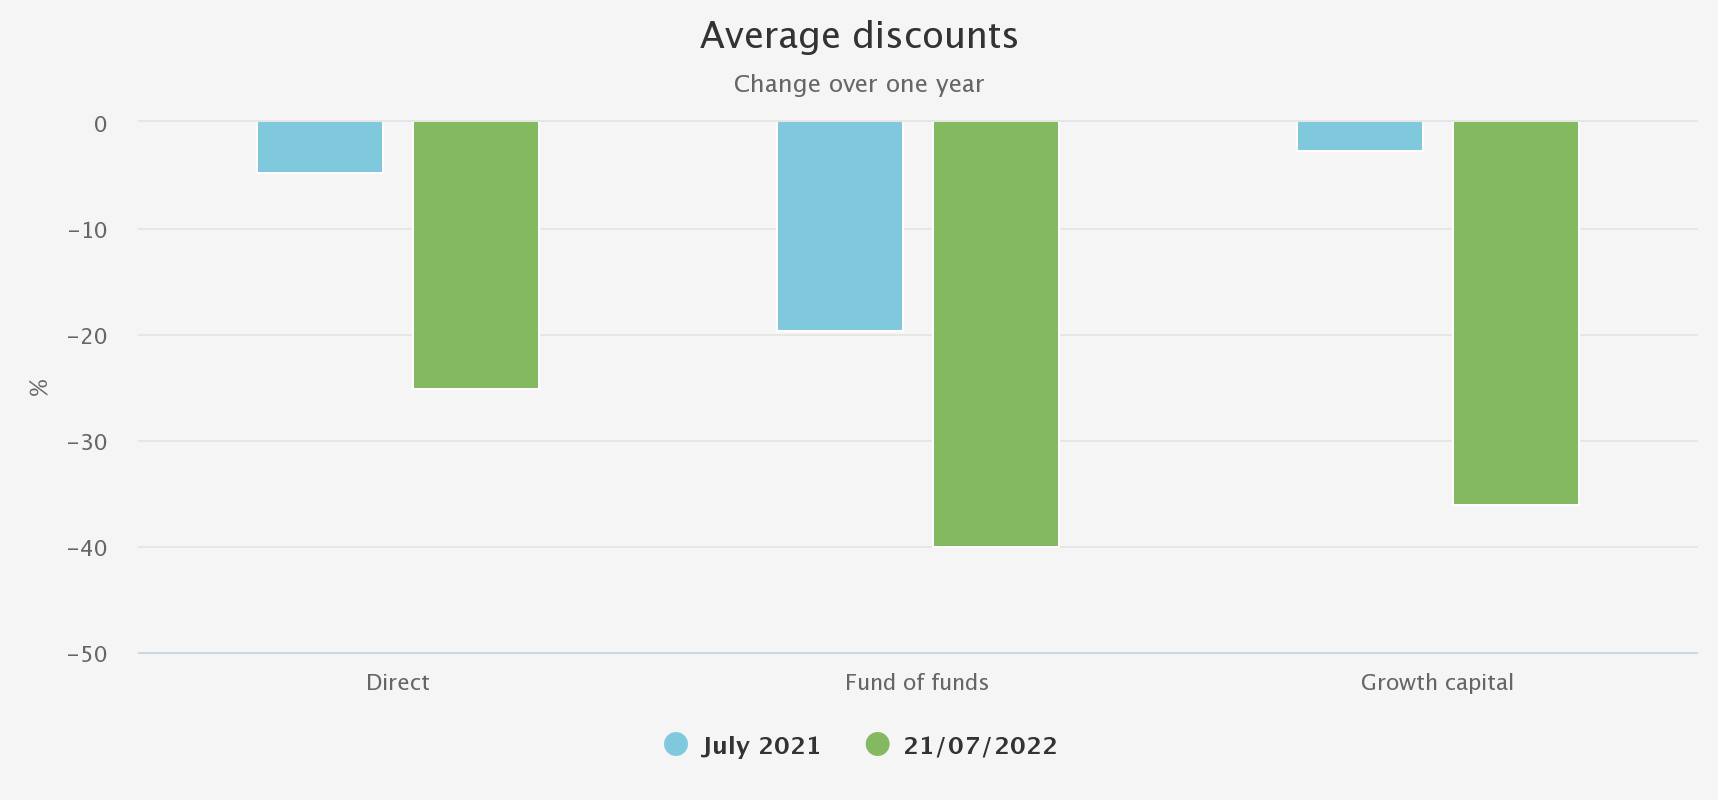
Source: JPMorgan Cazenove, Kepler Partners. Past performance is not a reliable indicator of future results
In our view, these big moves in sentiment have been driven by concerns on two distinct, but related aspects: underlying company earnings and valuations. Earnings worries are a result of potential declining growth rates, either a result of inflation or from a looming recession. Valuations thanks to the decline in public markets is symptomatic of the former, but also directly impacts multiples used to value portfolio companies. We examine each influence in turn, to evaluate whether the significant de-rating in private equity looks justified.
Valuations
When it comes to valuations, we believe the growth capital and buyout portfolios are subject to very different forces. Growth capital companies are typically not yet profitable, but have hitherto been growing earnings fast. With the investment environment giving doubts about future financing rounds, investors like Chrysalis are rightly telling management to conserve cash until the funding environment is more conducive, even if it means a hit to short term growth prospects. These sorts of companies may find valuations suffer a double whammy, reflecting a higher discount rate (rising interest rates) and lower growth prospects. Additionally, the valuation methodology also arguably works against these companies in the current environment, as witnessed by Klarna recently, which had a $48 billion valuation last September, with the latest funding round done at a $5.9 billion pre-money valuation, an 87% valuation slide. Growth capital valuations are in many cases based on most recent funding rounds rather than earnings multiples, which worked well when global investors were falling over themselves searching for the next private decacorn or hectocorn. However, with liquidity now impinged and risk appetites reversed, there is more reluctance to invest in new funding rounds at previous high valuations, leading to mechanistic, and sometimes very dramatic falls in values within growth capital funds.
On the other hand, buyouts are generally wholly owned and controlled by a private equity manager (aka a ‘sponsor’ in a buyout deal). Buyouts are usually profitable, and periodic valuations are determined on a ‘mark to model’ basis. This has attracted criticism from some quarters in the past, but for good or for bad, tends to result in a relatively smooth trajectory derived from a highly consistent valuation methodology. Earnings growth is usually the main driver of increases in valuations, outside of that derived from any uplift from selling an asset. Listed company valuations are one input in determining valuation multiples, but also comparable private equity deal valuations. As we discuss below, private equity managers have record amounts of capital to deploy and so, for buyouts that continue to deliver earnings growth, we understand that deal valuations have so far not fallen by anything like as much as public market indices. Reinforcing this, private equity managers can afford to play the long game and, if a bid for a company doesn’t match expectations, they can afford to hold on for a better or more realistic price.
These factors suggest that, absent a change in expected earnings, valuation changes for private equity companies in the current investment environment will not be as dramatic as that seen by growth capital companies or public market equity indices. In many cases, we believe buyout valuations are usually conservative, with the manager not incentivised to write up the value of investments (management fees are generally based on committed capital, and performance fees are based on realised gains). That said, it is true that valuations across portfolios have been rising: we reproduce a chart from Numis below, which illustrates this point. One might argue that despite buyout valuations potentially being higher than listed equity indices currently, to the extent that earnings growth continues to come through, current valuations may be justifiable. Indeed, as we discuss below, buyout valuations could still be regarded as conservative.
SELECTED LISTED PE – MULTIPLES OVER TIME
Source: Numis
Evidence for conservatism in buyout valuations (over the long run) is reflected by the fact that it is very rare that buyout managers announce a sale of an asset, without reflecting an uplift to the previous carrying value. Examples of this abound in nearly all of the listed private equity RNS announcements over time. Announcements made over the past quarter show that realisations are still being achieved, and still at valuations in excess of those used to calculate NAVs. ICG Enterprise Trust (LSE:ICGT), for example, a hybrid fund of fund and direct private equity investor, recently announced Q1 results which showed 17 full exits from the portfolio having occurred in the three months to 30 April 2022, at an average uplift of 23%. This is lower than previous financial years which have ranged from 31% to 40% on average, potentially suggesting a degree of pressure on pricing to get deals across the line. That said, this is only one quarter and the average for the full year may trend upwards towards the long-term average. NB Private Equity Partners (LSE:NBPE)is a direct investor in private equity deals (as a co-investor) alongside other private equity managers. It has a more concentrated portfolio than the fund of funds (around 95 holdings), and during 2022 has so far reported realisations of five companies at a premium to December 2022 valuations of 8% (and 2.9x cost). We understand that the vast majority of investments within the portfolio remain profitable, and the managers have so far not seen a negative impact on earnings which gives them cause for alarm.
Further support for valuations over the short term is in our view likely to come from the significant firepower that private equity managers have accumulated. We understand that current fundraising has been running strongly, and so pressure to deploy capital remains. For the directly investing trusts, including NBPE, this offers the opportunity to add value through “stock-selection”. NBPE looks to invest in high quality companies (hard to replicate, barriers to entry, recurring revenues), alongside premier PE managers investing in their core area of expertise, with strong potential earnings growth and prudent capital structures. These sorts of company are exactly the sort that other private equity managers like to buy.
Oakley Capital (manager of Oakley Capital Investments (LSE:OCI) aims to be the first private equity investor in companies, which means that other private equity managers may make a natural purchaser once the Oakley team have delivered on the first stage of their business plan. Recent evidence would suggest that this is happening, with recent exits such as Facile sold to Silver Lake, Contabo to KKR, and TechInsights to CVC. In many cases, Oakley is choosing to reinvest a proportion of capital alongside these private equity investors, meaning shareholders maintain an exposure to these strongly performing companies.
CT Private Equity Trust (LSE:CTPE) (CTPE, or BMO Private Equity (BPET) before the recent name change) aims to invest with managers at an earlier stage in their development who target ‘lower mid-market’ deals. In a highly competitive background for private equity, the Columbia Threadneedle private equity team believe this puts them in a good position to continue to deploy capital at attractive rates of return, but also to benefit from realisation activity by feeding larger private equity managers’ deals from the CTPE portfolio as investments mature. As well as having net gearing, this has led to a strong NAV performance over 2021, with BPET only marginally the second best performing listed private equity trust over the period.
Over the long term then, buyout valuations look both more conservative, and less prone to wild swings than those of growth capital companies. As we discuss earlier, buyout valuation multiples are derived from a combination of inputs, of which public market comparables are the most visible. The graph below shows major equity indices since 31 March 2022, which shows that in GBP terms indices are down between 10% and high-teens, but there has been something of a recovery since the end of June.
SELECTED MARKET INDICES
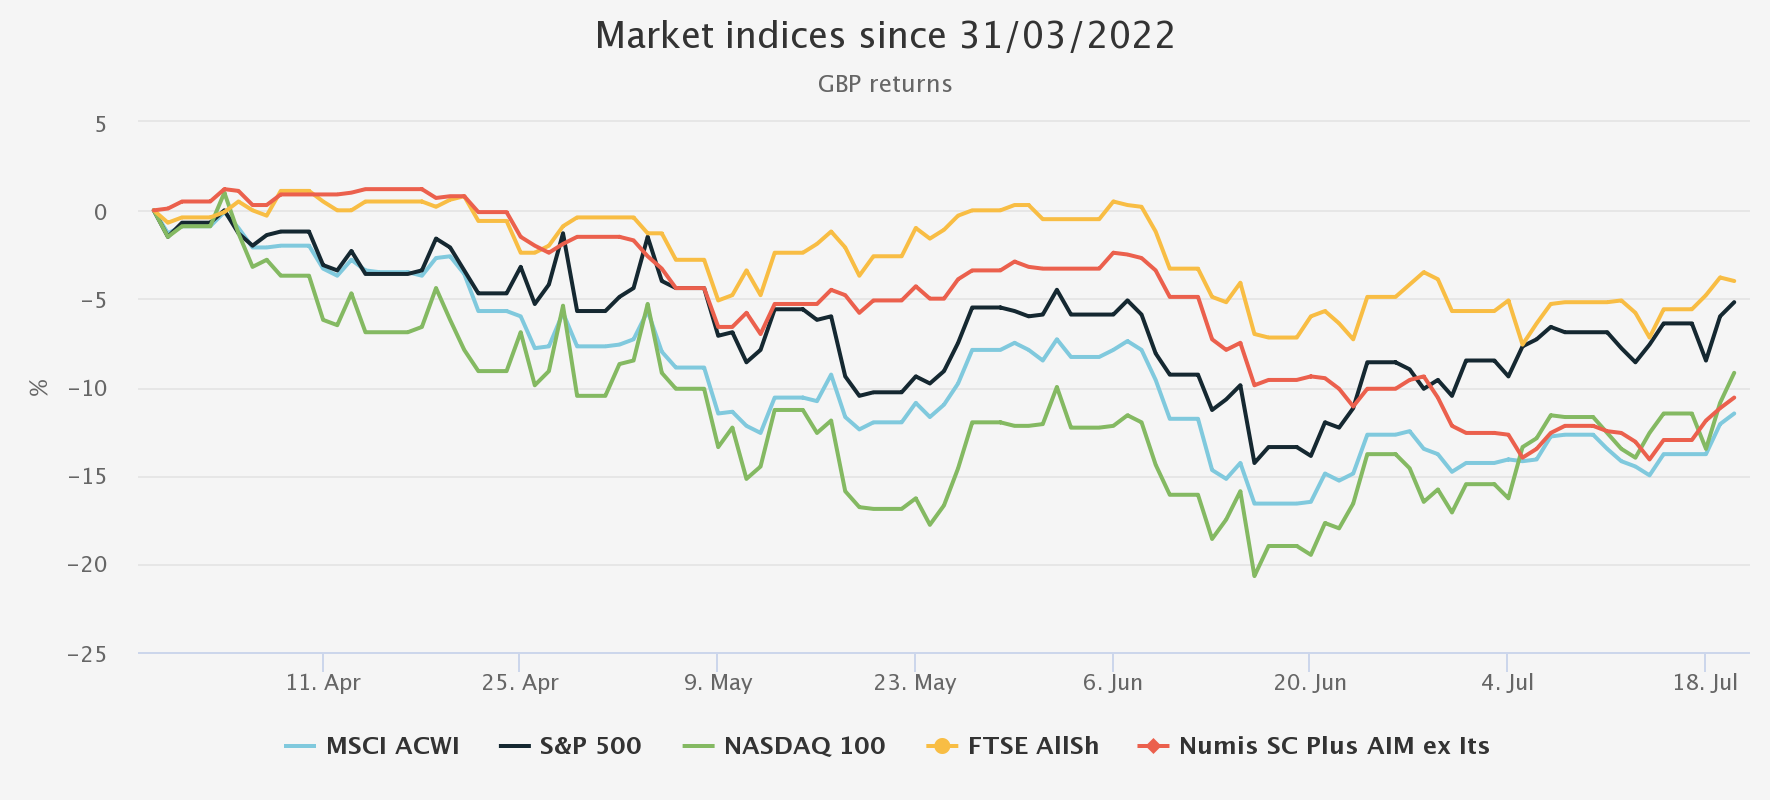
Source: Morningstar. Past performance is not a reliable indicator of future results
While public market comparable valuations have fallen, the graph below provides evidence that, contrary to the assertion that is sometimes put forward that private equity is “highly geared beta”, LPE NAVs have historically proven significantly more resilient than listed equities. Of course, it is worth highlighting at this point that share prices have not been as defensive as NAVs, with discounts widening out during periods of market stress, resulting in LPE share price returns often lagging public market returns. However, we would argue that NAVs are ultimately the key determinant of total returns, effectively the sun that the share price should orbit around. With buybacks and returns of capital the ultimate recourse for trusts that trade on persistently wide discounts, over the long-term NAV and share price total returns should be relatively tightly correlated. As such, we think the graph below should reassure investors that buyout NAVs have historically been less impacted than broader equity markets by significant falls, and suggests that NAVs – assuming earnings haven’t fallen faster than listed comparables – should fall less than public equities.
NAV DRAWDOWNS
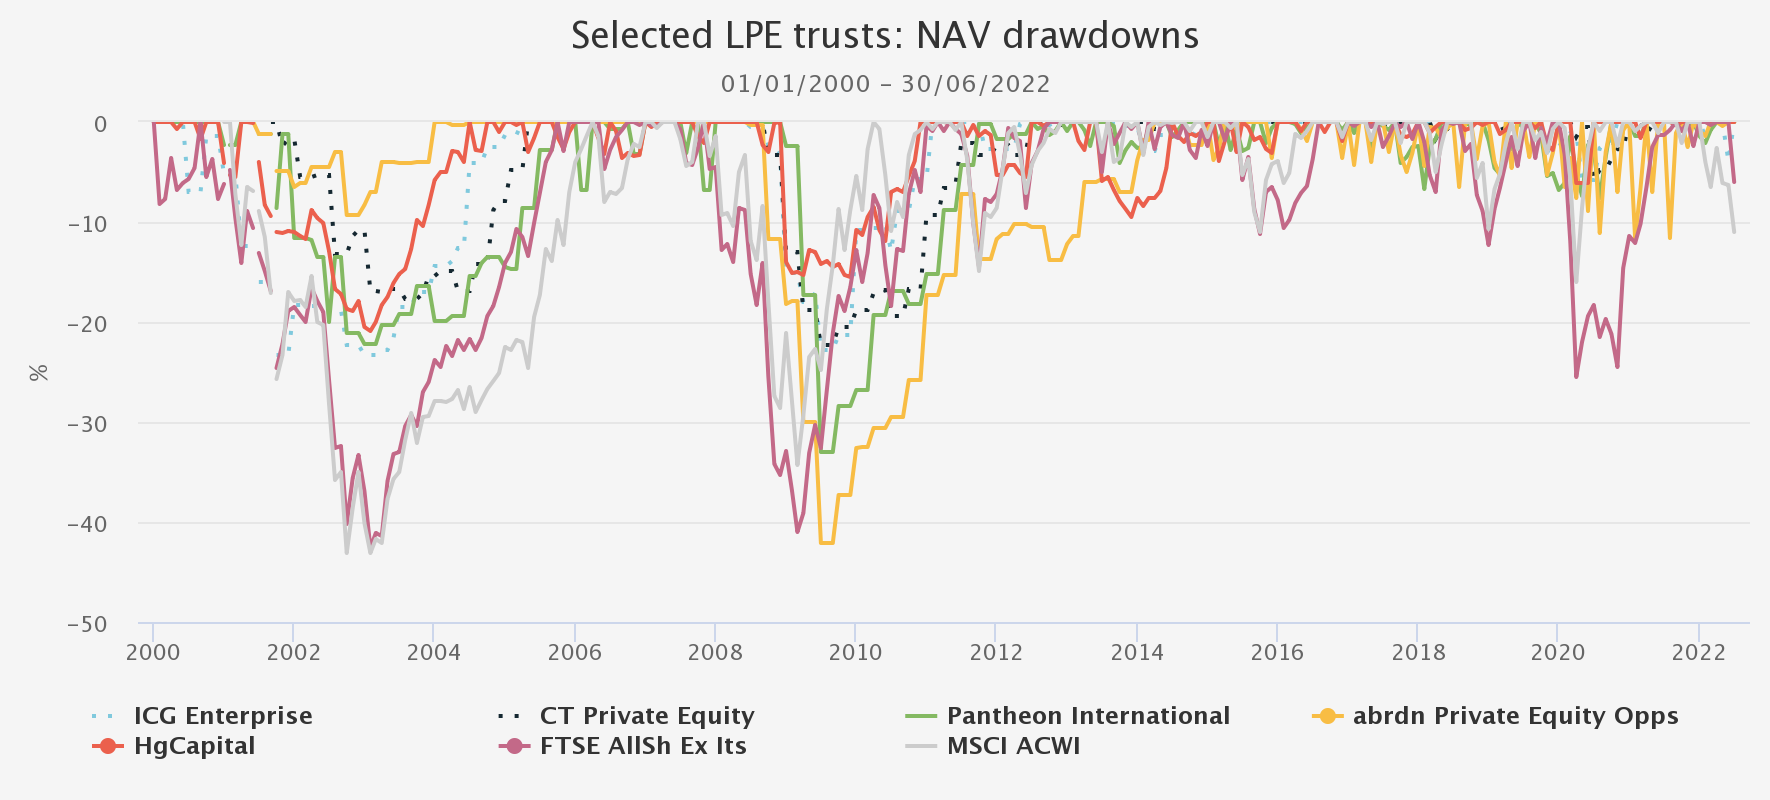
Source: Morningstar. Past performance is not a reliable indicator of future results
Earnings are key
Having discussed the prospect of valuations falling significantly, we now turn to earnings. With a recession in the US, Europe and the UK more a likelihood rather than a chance, we think it worth revisiting what impact a recession may have on earnings.
Again, there is a big disparity between growth capital and buyouts. Buyouts are largely profitable companies with demonstrable earnings growth. Buyouts are also typically more highly geared than growth capital and publicly listed companies (which might suggest earnings are more volatile), but buyout portfolios typically comprise defensive growth businesses, that have demonstrated strong earnings growth over the past few years with a relatively low impact from macroeconomic factors (or Covid for that matter). Many of these are niche businesses, and private equity managers exist to drive value through focussing on earnings growth and operational change. This leaves them well placed to navigate changes to the economic environment, such as the one we are entering now.
Latterly, mindful of the economic cycle, many private equity managers have been selecting ‘defensive growth’, which may prove more resilient and able to continue to grow earnings irrespective of the wider economy. That said, many companies’ management (and private equity managers) haven’t necessarily been proven through a recession of any kind, and certainly not a stagflationary recession. The next few quarters will provide useful evidence on how well buyout earnings are holding up. So far, the evidence from buyout managers who have reported seems to suggest that any valuation falls they are seeing are being mitigated by continued earnings growth.
As we have argued before, listed private equity portfolios are very different to those of listed indices, often represented by niche businesses in sectors experiencing secular growth. However, there is a clear distinction between trusts exposed to buyouts, and those at the growth capital end of the spectrum. As has been illustrated in the Chrysalis results recently, companies held by the growth capital trusts are typically unprofitable, and therefore require equity funding channels to remain open in order to continue to grow at a rapid clip. Chrysalis’ managers report that, given the market backdrop and how vicious ‘down-rounds’ can be, they are advising investee companies to prioritise profitability over growth, and extend the ‘cash runway’. By implication, with investment and growth prospects moderating (to reduce cash-burn), the time till these companies become profitable and start to deliver earnings, extends. As such, it is not hard to imagine that immediate prospects for NAVs in the growth capital sector are not particularly rosy.
Immediate prospects justify discounts?
A note of caution is clearly appropriate, but in our view it seems a strange situation when many buyout-focussed-trusts trade on the same level of discount as those that are growth-focussed- companies whose valuations rely less on earnings, and to a much greater extent on the vagaries of funding rounds and risk appetites of investors.
In our view the current environment points to the fact that, whilst growth capital discounts might rightly anticipate some fairly steep falls in NAVs, the same cannot be said for trusts exposed to buyouts. As such, the current discounts seen in trusts exposed to buyouts might present an opportunity. In the table below we show current discounts in the context of the long-term history, with trusts arranged in order of magnitude of the current divergence from the long-term average. In calculating averages, we have taken discount estimates from Morningstar since June 2008, which in our view represents a fair reflection of the modern, post-GFC era. Prior to this, many LPE trusts traded at significant premiums, with investors perhaps too carried away with the concept of Gordon Brown’s ‘goldilocks era’ of economic growth. If we were to assume a ‘worst case’ NAV fall for Q2 2022 of 10%, bearing in mind that trusts in the sector are pretty much ungeared, the table below suggests discounts for most trusts would still be wide in the context of their own history.
LPE TRUSTS: CURRENT DISCOUNTS VS LONG-TERM AVERAGE
| AVE. % DISCOUNT SINCE JUNE | 21/07/2022 DISCOUNT % | DIFFERENCE % | ||
| Pantheon International | -28.2 | -47.2 | -19 | |
| HarbourVest Global PE | -26.2 | -44 | -17.8 | |
| Apax Global Alpha | -13.9 | -30.4 | -16.5 | |
| CT Private Equity | -23.6 | -39.6 | -16 | |
| HgCapital | -7.9 | -23.3 | -15.4 | |
| ICG Enterprise | -25.7 | -37 | -11.3 | |
| Oakley Capital Investments | -24.2 | -32.1 | -7.9 | |
| NB Private Equity Partners | -27 | -34.7 | -7.7 | |
| abrdn Private Equity Opps | -27.1 | -32 | -4.9 | |
| Princess Private Equity Holding | -23.8 | -19.3 | 4.5 |
Source: Morningstar. Past performance is not a reliable indicator of future results
The graph below shows the historic discount of these trusts, compared to a 40% level – which reflects the current average of the Fund of Fund subsector. It suggests that discounts have rarely stayed wider than the 40% level for any length of time, aside from the period immediately post-GFC. One might argue that the GFC was a financial recession, and not necessarily an earnings recession. Concerns over the LPE sector at the time were mainly centred on balance sheets, which in many cases were overstretched, and so it might be argued that discounts remaining wide at that time were justified by investor concerns on leverage risks. By comparison, in the current era, balance sheets are in a significantly better position. According to data from Numis, of the sector at the time, 12 out of 16 trusts had leverage and overcommitment levels of over 150% of NAV. By contrast, most now have no leverage and very few have overcommitments that exceed 150%. In our view, this means that discounts are not a result of the market anticipating a repeat of 2008-09.
AVERAGE DISCOUNTS OVER TIME
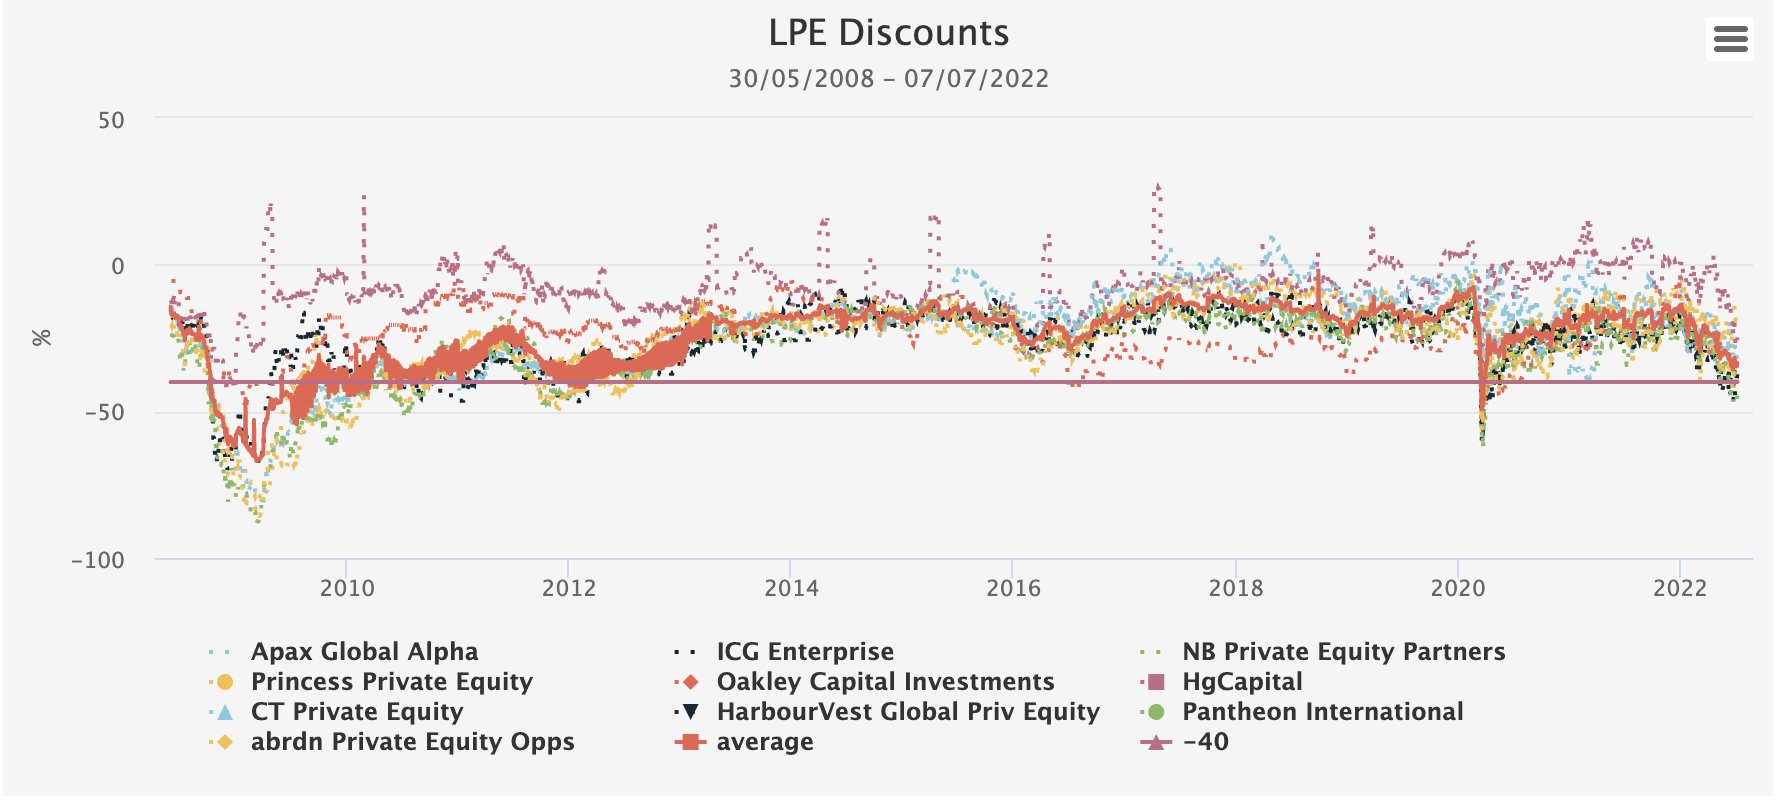
Source: Morningstar. Past performance is not a reliable indicator of future results
Conclusion
Private equity trusts of all types all share one feature that may mean optically wider discounts may be justifiable as markets fall. Valuations take time to calculate and filter through to published NAVs. As a result, investors may rationalise that a 40% discount to a 31 March 2022 NAV may in fact only be a 20% discount, once a fall in NAV is taken account of. Private equity trusts typically revalue portfolios quarterly at best, and so investors will next get a better feeling for what NAVs are (and therefore what the ‘real’ discount is) following publication of the 30 June 2022 NAVs. At the earliest, we might expect these during the third week of July, but some trusts take longer to publish NAVs.
We believe that, with respect to private equity trusts invested in buyouts, NAVs will likely not fall as far as comparable equity markets. As such, if this is proved the case, this may provide an element of support to share prices and discounts. However, in our view, the greater impact will be from reports on these trust’s underlying portfolio company earnings, and it is this that investors should be focussing on. If, as we suspect, earnings outperform those of listed markets in a recessionary environment, we think this should give a shot in the arm to discounts for trusts exposed to buyouts. For growth-capital trusts, unfortunately discount levels are likely to be less to do with ‘self-help’ and more with market appetites for risk, which are significantly less predictable.
Therefore, for investors looking to take advantage of the current market, the more established listed private equity trusts that are exposed to buyouts look mispriced. Looking back at history, there are relatively few times when they have traded at discounts as wide as this, and investors have gone on to make significant returns as discounts have narrowed and NAVs have continued to grow.
Kepler Partners is a third-party supplier and not part of interactive investor. Neither Kepler Partners or interactive investor will be responsible for any losses that may be incurred as a result of a trading idea.
These articles are provided for information purposes only. Occasionally, an opinion about whether to buy or sell a specific investment may be provided by third parties. The content is not intended to be a personal recommendation to buy or sell any financial instrument or product, or to adopt any investment strategy as it is not provided based on an assessment of your investing knowledge and experience, your financial situation or your investment objectives. The value of your investments, and the income derived from them, may go down as well as up. You may not get back all the money that you invest. The investments referred to in this article may not be suitable for all investors, and if in doubt, an investor should seek advice from a qualified investment adviser.
Full performance can be found on the company or index summary page on the interactive investor website. Simply click on the company's or index name highlighted in the article.
Important Information
Kepler Partners is not authorised to make recommendations to Retail Clients. This report is based on factual information only, and is solely for information purposes only and any views contained in it must not be construed as investment or tax advice or a recommendation to buy, sell or take any action in relation to any investment.
This report has been issued by Kepler Partners LLP solely for information purposes only and the views contained in it must not be construed as investment or tax advice or a recommendation to buy, sell or take any action in relation to any investment. If you are unclear about any of the information on this website or its suitability for you, please contact your financial or tax adviser, or an independent financial or tax adviser before making any investment or financial decisions.
The information provided on this website is not intended for distribution to, or use by, any person or entity in any jurisdiction or country where such distribution or use would be contrary to law or regulation or which would subject Kepler Partners LLP to any registration requirement within such jurisdiction or country. Persons who access this information are required to inform themselves and to comply with any such restrictions. In particular, this website is exclusively for non-US Persons. The information in this website is not for distribution to and does not constitute an offer to sell or the solicitation of any offer to buy any securities in the United States of America to or for the benefit of US Persons.
This is a marketing document, should be considered non-independent research and is subject to the rules in COBS 12.3 relating to such research. It has not been prepared in accordance with legal requirements designed to promote the independence of investment research.
No representation or warranty, express or implied, is given by any person as to the accuracy or completeness of the information and no responsibility or liability is accepted for the accuracy or sufficiency of any of the information, for any errors, omissions or misstatements, negligent or otherwise. Any views and opinions, whilst given in good faith, are subject to change without notice.
This is not an official confirmation of terms and is not to be taken as advice to take any action in relation to any investment mentioned herein. Any prices or quotations contained herein are indicative only.
Kepler Partners LLP (including its partners, employees and representatives) or a connected person may have positions in or options on the securities detailed in this report, and may buy, sell or offer to purchase or sell such securities from time to time, but will at all times be subject to restrictions imposed by the firm's internal rules. A copy of the firm's conflict of interest policy is available on request.
Past performance is not necessarily a guide to the future. The value of investments can fall as well as rise and you may get back less than you invested when you decide to sell your investments. It is strongly recommended that Independent financial advice should be taken before entering into any financial transaction.
PLEASE SEE ALSO OUR TERMS AND CONDITIONS
Kepler Partners LLP is a limited liability partnership registered in England and Wales at 9/10 Savile Row, London W1S 3PF with registered number OC334771.
Kepler Partners LLP is authorised and regulated by the Financial Conduct Authority.