Tullow Oil: our analyst’s view on this troubled share
There’s concerns for Brent Crude and Tullow. Our chartist explains why.
2nd September 2020 09:47
by Alistair Strang from Trends and Targets
There’s concerns for both Brent Crude and Tullow. Our chartist explains why.

Tullow Oil and thinking crudely (LSE:TLW)
Tullow Oil (LSE:TLW) has certainly not had to seek troubles.
Trading above 1,600p back in 2012, the shares could be picked up for 7.5p in March of this year, the Covid-19 drop finally delivering a price level which shall hopefully be regarded as “bottom”.
Despite the bounce from 7.5p proving very slightly useful, we have ample reason for concern at the chosen trajectory. To be blunt, it is heading down again!
Crude oil prices are proving a concern as Brent, for instance, is supposed to be heading to the $50 (£37.4) mark, this being a logical level for a bit of a pause on its way to the $55 level.
Unfortunately, the last two months have witnessed Brent making insipid movements and this appears to be infecting the oil sector with a considerable case of nerves.
Perhaps too frequently we whine about what to expect if a price refuses to go up but unfortunately this is often the case when gravity rears its ugly head.
In the case of Tullow, we do not need to worry about gravity but instead cold visuals on the chart.
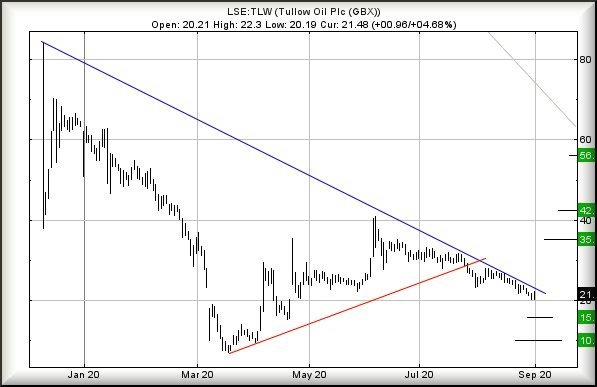
The downtrend since the start of December 2019 has been quite vivid and the market appears rigid in ensuring Tullow does not break trend.
At time of writing, Tullow is trading around 21p and we feel we can only identify a trigger level at 27p as a point above which some hope is possible.
Above 27p calculates with an initial ambition of 35p with secondary, if exceeded, at 42p.
In fact, should the 42p level be achieved, there is a serious risk it could be ignored with a frenzied rise to 56p kicking into life.
Unfortunately, as mentioned earlier, Tullow feels destined to head downward.
Below 20p looks very capable of producing some reversals to an initial 15p with secondary, if broken, at a hopeful bottom of 10p.
Should this scenario appear, a bunch of folk are liable to shout "double bottom", taking long positions, driving some price recovery. We hope so, anyway!
Source: Trends and Targets Past performance is not a guide to future performance
Alistair Strang has led high-profile and "top secret" software projects since the late 1970s and won the original John Logie Baird Award for inventors and innovators. After the financial crash, he wanted to know "how it worked" with a view to mimicking existing trading formulas and predicting what was coming next. His results speak for themselves as he continually refines the methodology.
Alistair Strang is a freelance contributor and not a direct employee of Interactive Investor. All correspondence is with Alistair Strang, who for these purposes is deemed a third-party supplier. Buying, selling and investing in shares is not without risk. Market and company movement will affect your performance and you may get back less than you invest. Neither Alistair Strang or Interactive Investor will be responsible for any losses that may be incurred as a result of following a trading idea.
These articles are provided for information purposes only. Occasionally, an opinion about whether to buy or sell a specific investment may be provided by third parties. The content is not intended to be a personal recommendation to buy or sell any financial instrument or product, or to adopt any investment strategy as it is not provided based on an assessment of your investing knowledge and experience, your financial situation or your investment objectives. The value of your investments, and the income derived from them, may go down as well as up. You may not get back all the money that you invest. The investments referred to in this article may not be suitable for all investors, and if in doubt, an investor should seek advice from a qualified investment adviser.
Full performance can be found on the company or index summary page on the interactive investor website. Simply click on the company's or index name highlighted in the article.