ii rated products methodology
ii rated products methodology
Overview
This document confirms how we choose our rated products. These include Super 60 and ACE 40 investments, Quick-start Funds and Investment Pathways. It also explains who selects them and how we categorise them into different groups. Plus, it details the analysis and selection process and the monitoring process.
If you do not understand some of the terms used in the methodology, we have a helpful glossary at the bottom of the page.
Our selection is derived from the whole spectrum of collective investments and includes both active and passive products. On the active side, we include both open and closed-ended structures, being either single or multi-asset vehicles. From a passive perspective, we look at both Index Trackers and Exchange Traded Funds.
Our rated funds aim to be suitable for all investors, irrespective of experience. We aim to provide a set of high-quality choices, across different asset classes, regions, and investment types.
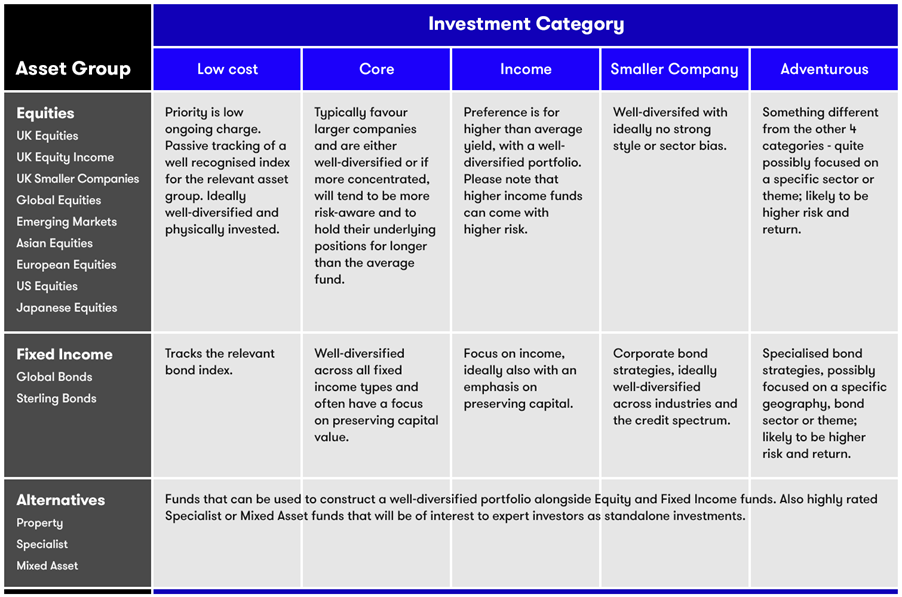
Our aim is to limit the total number of funds to roughly around 60 for the Super 60 and 40 for the ACE 40 lists at any one time. We apply a 10% limit either way. As a result of this the Super 60 can contain up to 66 funds. The UK and global equity categories offer a larger number of options and the alternative asset groups fewer, reflecting typical customer demand as well as the range of funds available. The alternative asset groups and the adventurous investment category are primarily designed to appeal to more experienced investors.
Selection Process
We have chosen to partner with Morningstar’s Manager Selection Services group to enhance our fund selection process and they will follow the principles summarised below. For our sustainable offering they will follow the same process with some additional nuances.
Initial screening
We look at all available tradeable options in the selection process for the ii rated products. Then, using the filters below, pick out an initial list of viable funds for full review and discussion.
The starting point for our ACE 40 sustainable list is the broadest possible universe of sustainable investments available to the UK retail investor. This universe is made up of the funds, trusts and ETFs that Morningstar, our data provider, has deemed a 'Sustainable Investment'. In order to be deemed sustainable the investment must identify itself as sustainable by incorporating a sustainable mandate or approach in the investment's strategy. Then, further filters are applied to reach the final ACE 40 list of rated funds.
Investment Criteria
- Must be tradeable on our platform
- Exclude funds that are either sub-scale or experiencing capacity issues
- Must be sufficiently liquid to allow for daily dealing
- GBP version chosen where possible and suitable: unhedged share classes are usually preferred (see footnote 1) meaning investors may be exposed to currency risk
- Minimum track record of one year - preferably three
Performance analysis
Performance is analysed over both short and longer time periods. This allows us to identify those actively managed funds and trusts that have historically delivered consistently superior returns compared with their relevant peer groups. In the case of passive funds, the key performance indicator is tracking error versus the relevant market index – the tighter, the better. This ensures these investments provide exactly what they say on the tin.
We examine performance over short, medium and long periods. We look at quintile/quartile rankings relative to their closest peers where appropriate. We are happy to consider funds that may have underperformed recently, but historically have a good longer-term track record. We also consider some funds with short performance track records.
Risk profiling
Outsized historical returns are sometimes generated by managers who take inappropriately high risks. Consequently, the rating process also takes into account risk-adjusted returns.
To do this we quantitatively analyse the risk profile of all candidates using various metrics including Sharpe ratios, information ratios, volatility (Standard Deviation) and gearing where applicable, i.e. investment trusts. We eliminate investments with poor risk characteristics relative to their peers over a specific time period, depending on the strategy. This could be three or five-years or longer.
We also evaluate fund capacity and portfolio liquidity by looking at total assets under management (AUM) run by a manager, net inflows as well as portfolio liquidation profiles. For investment trusts we also analyse dealing spreads and discount or premium to underlying net asset value.
Cost assessment
We next assess the charging structure of each fund in the universe to ensure that it provides good value for money.
Cost Criteria
- We avoid investments where there is an initial charge.
- The Ongoing Charges Figure (OCF) must be good value for money and not significantly higher than its peer group average. Exceptions may be made for highly specialised funds.
- The cheapest share class available is chosen where more than one class exists.
Qualitative assessment
Qualitative analysis allows us to look in more detail at how the investment is run by the manager. We examine how the fund management firm operates, its reputation, management team experience, investment style and process.
We favour managers that operate within a strong, supportive structure, have a clearly defined and disciplined investment philosophy and process and an experienced team that can demonstrate consistent implementation of their process.
Sustainable assessment (for ACE 40)
As part of the qualitative due diligence process, we also seek to understand the manager’s approach to sustainability.
Each fund on the ACE 40 must sit under the Morningstar Sustainable Attributes framework which identifies sustainable investments using the fund's own stated objectives and categorises them as either a "General ESG Fund" or a "Sustainability Themed Investment" (further details can be found here). Our qualitative assessment allows us to verify that the sustainability approach is actually being implemented within the overall investment process and evidenced in the final portfolio.
This allows us to categorise the manager’s investment style correctly but more importantly, to verify that their approach is actually being implemented within the overall investment process and evidenced in the final portfolio.
Selection and approval
By this point in the process for the Super 60, we will have distilled the original investment lists to around 260 high quality funds, investment trusts and passives. The investments chosen are what we believe are the most suitable candidates for our asset groups and investment categories described above.
For our ACE 40 list we also consider all the funds on the sustainable investments long list.
The selection and approval process is overseen and challenged by the Investment Committee. The committee comprises of both internal experts and can draw on independent external experts as required.
Review and refresh
We maintain regular contact with the management houses of all investments on our rated lists. This ensures each investment continues to be managed in line with our expectations. A detailed fund questionnaire is completed every year for constituents of the Super 60 and ACE40. This covers all the key areas of our due diligence process, with information being sourced directly from the management company concerned.
The lists are monitored continuously for ‘yellow card’ events. Examples include, but are not limited to, fund manager moves, soft closures (where a fund closes to new money) or a major re-rating from external or internal sources. Investments that experience a yellow card event are automatically placed under formal review.
In addition, the performance of the lists is monitored on a monthly basis. Performance is based on peer group rankings over multiple periods. Our approach aims to identify, in a timely manner, those that are struggling. In such a scenario, we assesses whether this is caused by fundamental reasons rather than temporary tactical reasons. For passive options tracking error and performance is reviewed. We also keep an eye on investment trusts trading at a high discount or premium to net asset value.
Any rated investment identified as a possible concern by the FWG will become subject to enhanced monitoring. If the situation does not improve and we begin to suspect an underlying problem with the investment, it is then placed under formal review.
Once an investment has been placed under formal review, either for performance reasons or because of a “yellow card” event, we will conduct a thorough investigation.
Our goal is to reach a decision one way or another within three months of the date when the investment was placed under formal review. This gives us enough time to discuss our concern with the relevant fund manager and/or allow an opportunity for improvement. We tell customers immediately via the ii website when any investment has been placed under formal review. We communicate again when a final decision has been made to retain or replace the fund.
When a fund is removed, we usually seek to replace it with a new option in the same asset group. This is unless we believe there is insufficient choice for investors in that asset group. The shortlist of investments mentioned above acts as a substitute bench. This ensures replacements can be made promptly.
We undertake a full review every quarter. The review discusses all investments on the list and consider any changes. We also look at potential alternatives. Market events are also considered. Decisions are made and agreed by the committee.
Any changes that are made will be listed on the ii website, along with a rationale for the change. A quarterly update of the list is part of our regular editorial features. This also includes a list of all changes made during the quarter.
Once a year we refresh the initial list of all tradeable investment options. This is to check whether a fund remains fit for the purpose it was originally selected. We also consider any recent fund offerings and significant market events so that our list remains fresh. The danger of not adopting a full review is that you might keep less attractive investments on the list for longer and miss good new opportunities.
Despite these measures to replace and refresh we do not anticipate a high rate of turnover. We expect most funds to retain their rating over several years. This is consistent with our aim of selecting investments that should be suitable for long term investment purposes. We publish our annual reviews for the Super 60 in January and October for the ACE 40.
Governance
The Investment Committee is an executive level committee. The committee provides oversight and challenge to the generation and dissemination of research recommendations. This includes Rated Funds, Model Portfolios, and pathway investments. Their role is to oversee how the firm’s research recommendations are researched, compiled, monitored, maintained and presented to customers.
July 2024
Glossary
Asset Class Definitions
Equities
Also known as shares, equities represent a share in the ownership of a company. The investment return from holding equities is made up of:
- capital gains (or losses) from the rise (or fall) in price of the share; and
- dividends, a sum of money paid regularly by a company to its shareholders out of its profits (or reserves)
Investors are able to buy and sell shares in companies across the globe. These include:
- UK equities: UK equity funds invest in shares listed on the London Stock Exchange. These include shares in large companies in the FTSE 100 index, through to the next 250 largest in the FTSE 250, all the way down to the smallest companies. There are a large range of funds available.
- UK smaller companies: Funds that invest in UK smaller companies specifically look at the smallest companies listed on the London Stock Exchange. Typically the shares are newer, with a shorter track record. This means they are considered higher-risk than larger, more established shares with a longer track record. The sector also includes Alternative Investment Market (AIM) stocks. AIM is the London Stock Exchange’s international market for smaller growing companies.
- Global equities: Funds that are called Global Equity funds give investors exposure to markets in all geographic areas across the world. These funds differentiate themselves by having to not only choose which underlying shares to buy, but also how much to invest in each region.
- Emerging markets: Countries that have a lower per-capita income and are moving towards becoming more developed. These regions typically do not have an established track record and come with higher risks for investors.
- Asian equities: Asian equities include all countries from the region, including very established markets like Japan and Hong Kong, newer developed markets like China and Taiwan and those that are still developing, such as Malaysia and Vietnam. Most Asian funds have larger weightings to the bigger markets and only a small weighting to emerging Asian markets.
- European equities: European equities include all countries from the region, including very established markets such as Germany and France, newer developed markets such as Poland and Russia and those that are still developing, such as Latvia and Croatia. Most European funds have larger weightings to the bigger markets and only a small weighting to emerging European markets.
- US equities: These funds invest in shares listed on stock exchanges in the United States. These include the largest US companies in the S&P 500 index all the way down to the smallest companies in the US that are often members of the Russell 2000 index. There are a large range of funds available.
- Japanese equities: As the most developed market in Asia, investors often want exposure to Japan separately to other Asian countries. The main Japanese market index is the Nikkei 225. The Nikkei measures the performance of 225 large, publicly owned companies in Japan
Equity Income
Equity Income is a specific investment strategy where fund managers aim to invest in shares in companies that pay dividends – regular annual or quarterly cash payments to investors out of profit or reserves. While most larger stocks pay dividends, smaller companies that are starting out typically do not pay out as much as they reinvest profits in growing their business. Equity income fund managers typically try and invest in stocks that pay larger than average dividends to generate a stable regular income for those investors who want it.
- UK equity income: UK Equity Income fund managers invest in dividend paying stocks from the London Stock Exchange (typically these will be larger, established, companies) to generate a stable income for investors looking for regular income from their equity investments.
- Global equity income: Global Equity Income fund managers invest in dividend paying stocks from around the world (typically these investments will be in larger, established, companies) to generate a stable income for investors looking for regular income from their equity investments.
Fixed income
Fixed income is another term for bonds. These are loans taken out by a government or company which it promises to repay over a fixed timeframe along with a regular interest payment (in effect, the rate paid annually or semi-annually on the loan).
- Global bond funds
Funds that invest at least 80% of their assets in fixed interest securities. - Sterling bond funds
Funds that invest at least 80% of their assets in sterling denominated bonds (or bonds hedged back to sterling).
Alternative Investments
Most investments are either categorised in the equity or fixed-income sectors. But there are many other ‘alternative’ investments you can choose, and these include commercial property (investments in shops, offices and warehouse) and commodities (raw materials such as gold, copper, oil or agricultural products such as wheat and coffee). These ‘alternative’ investments can play an important diversifying role, having the potential to mitigate losses when equity and/or bond prices are falling. Research shows that a modest allocation to carefully selected alternatives can reduce overall portfolio volatility without materially impacting the overall expected return.
- Property
Real-estate assets, usually comprising business premises rather than residential properties. These typically include retail (individual shops or shopping centres), retail warehouses, offices and/or industrial premises. The fund manager will earn a rental yield on the premises it owns in its portfolio, as well as making a capital gain/loss on any changes in the underlying value of the properties it owns. - Specialist
Funds within the specialist sector are ones that have an investment universe that is not accommodated by the mainstream sectors. This sector contains a diverse range of investment options. A number of these funds are commodity orientated, but it can include a wider range of non-standard financial assets, e.g. infrastructure.
Mixed asset
Fund managers in this sector have a mandate to invest in assets across a range of different asset classes, e.g. equities plus fixed income plus potentially cash. These funds typically specify the maximum amount they have invested in equities, which allows customers to choose how much exposure they want.
Other terms
Passive investing
Passive investing, also known as index tracking, is where a fund follows a set benchmark (usually a stock market index such as the FTSE 100 or S&P 500) and aims to replicate the performance of that benchmark for investors.
Ongoing charges figure (OCF)
The annual cost of investing in a fund, expressed as a percentage of the value of your investment. Trading costs (incurred when the fund manager buys or sells investments held by the fund) are not included in the OCF, so the true annual cost will be higher than the stated OCF. The total cost of the fund calculates everything included in the annual running costs. Please note that all performance figures are calculated net of all costs incurred in running a fund.
Risk profiling
Individual funds will generate returns that vary dependent on their underlying holdings and the behaviour of the market as a whole. Risk profiling allows us to measure how a fund performs in different scenarios and whether the returns it achieves are based on higher than normal risks, or good management. The aim is to try and identify funds which achieve good returns for the level of risk they take.
Sharpe ratio
A useful aid for investors hunting for active funds that stand out from the crowd. The Sharpe ratio is a way of measuring the historical risk-adjusted return on an investment. In other words, how much excess return (over and above a risk-free rate, e.g. yield on government bond) you have received for each ‘unit’ of risk being taken by the portfolio manager. The higher a fund's Sharpe ratio, the better its returns have been relative to the risk it has taken.
The Sharpe ratio is calculated as the return from the investment (for example, over the past three years) minus the risk-free return over that period (for example, from a government bond), divided by the standard deviation of the portfolio’s excess return.
Information ratio
The information ratio for an actively managed fund is virtually identical to the Sharpe ratio, but the risk-free rate of return used in the calculation is the figure that would be earned on a benchmark index. This benchmark is, in effect, what the asset manager might be expected to hold in the fund if he/she had no view on the market.
The ratio is calculated as the return from the portfolio (for example over the past three years) minus the benchmark return over that period, divided by the standard deviation of the portfolio’s excess return over that benchmark.
Tracking error
If you are investing in a passive, or tracker fund, which aims to mimic the return on a broad market index by holding a smaller number of assets than there are in the index, you would want that fund to stick as closely as possible to the return on the underlying index. The tracking error for a passive fund reflects the difference between the return on the fund and the return on the underlying index – the lower the tracking error, the closer the passive fund is to its underlying index.
Gearing
Some investment trusts enhance returns by borrowing cash to invest in additional financial assets. At its simplest, gearing means borrowing money to buy more assets in the hope the company makes enough profit to pay back the debt and interest and leave something extra for shareholders. However, if the investment portfolio does not perform well, gearing can increase losses. The more an investment company gears, the higher the risk.
Dealing spreads
The dealing spread reflects the difference between the price at which you can buy a particular investment, and the price at which you can sell it. Ideally, you would want this spread to be as narrow as possible, so that when you finally come to sell an investment you do not sacrifice too much of your gains. The narrower the dealing spread, the more liquid an investment is considered to be.
Premium/discount to underlying (or ‘net’) asset value
The underlying (or net) asset value of a fund is the sum total of the value of all the underlying assets held by that fund, minus the value of all the liabilities (e.g. loans).
Where a fund will price itself at or close to this underlying asset value, an investment trust trades in the market wherever buyers and sellers choose to transact. This price may be higher than the net asset value of the fund (i.e. at a premium), or – more usually – it may trade below the net asset value of the fund (i.e. at a discount).
A trust trading at a discount or premium to its net asset value can be a good or a bad thing depending on whether you want to buy or sell that trust. Some popular trusts trade at significant premiums, reflecting market confidence in the ability of the manager to carry on outperforming the market. Some trusts that hold illiquid assets trade at substantial discounts, reflecting the illiquidity of the underlying assets.
1 The exception is global bonds, where hedging allows you to take pure credit risk in GBP by eliminating the FX risk, thereby improving the protection characteristics of this particular asset in a broader customer portfolio