Chart of the week: are Apple shares about to race past record high?
Analyst John Burford studies Apple's chart and reveals where he thinks the shares are heading next.
5th July 2021 09:45
by John Burford from interactive investor
Analyst John Burford studies Apple's share price chart and reveals where he thinks the tech giant is heading next.
Is Apple retaining its shine?
Last September, Apple (NASDAQ:AAPL) shares surged to an all-time high in the $140 area. Since then, they have basically gone nowhere. But to a card-carrying chart reader, the price path taken since then is highly instructive – and potentially revealing.
As one of the leading tech titans, it is a major force of both the Dow Jones and the Nasdaq indices. Interestingly, while the Nasdaq has been in a near-vertical climb off the Corona Crash lows and was making new record highs in the last two weeks, the Dow has lagged badly and still trades under its 10 May high.
That is a lengthy divergence of eight weeks – and could be an important indication that a correction lies ahead – unless the Dow can improve soon into new high ground.
Of course, this divergence has been partly the result of a switch into pandemic-defying tech shares and out of traditional 'value' equities as represented in the Dow. But just as a pendulum reaches a limit before swinging back, this process will reverse at some point. As always, the question is: when will value trump tech?
- Want to buy and sell international shares? It’s easy to do. Here’s how
- Why reading charts can help you become a better investor
- Six things you must do before buying any share
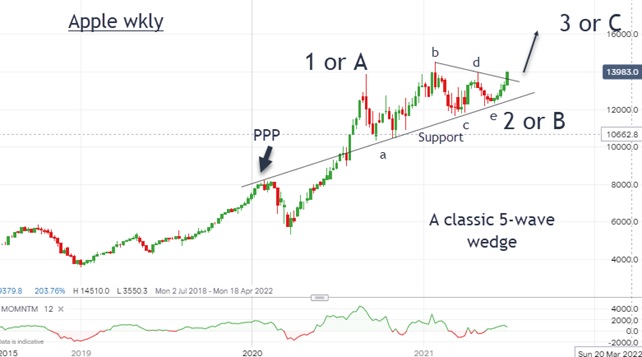
This is the long-range weekly chart from 2018:
Past performance is not a guide to future performance.
I have labelled the August 2020 high as my wave 1 (or A) and, from there, the market corrected down to wave 'a', rallied in wave 'b', then corrected down again in wave 'c', then up in wave 'd' and finally dipping in wave 'e'.
The whole pattern is a classic five-wave wedge/triangle. These almost always appear in either a fourth wave position of a five-wave impulse pattern, or in a B wave of an A-B-C pattern. My view is it describes a B wave – and these are corrective.
From the 'e' wave low, it then started its latest rally phase and has now broken above my minor trendline in a bullish show of strength.
- Hydrogen stocks: time to fill up with these hot shares?
- Chart of the week: should you buy ITM Power shares on this dip?
- Discover how to be a better investor here
- Check out our award-winning stocks and shares ISA
Note the lower trendline has a Prior Pivot Point (PPP) (see pp 52 – 53 of my book) and all of the subsequent dips to the waves 'a, 'c', and 'e' lows were held precisely at this line. This made it a solid line of support. Any future dips to this line – currently at the $126 area - would likely hold. But if the market could break solidly below it, all bullish bets are off.
For now, the trend is very much up and a new all-time high above $145 seems highly likely (currently $140). The next earnings report is due 29 July. I consider it a fool's errand trying to estimate not only the details of the earnings to come, but also the market reaction to whatever emerges.
We could see a run-up in Apple shares into this report – and then a re-assessment. Many may well be taking major profits in this event.
There is little doubt that bullish sentiment remains at peak levels and only a small disappointment could create a little havoc in markets generally.
Cash levels remain at exceedingly low levels in Money Market US funds. Cash is Trash is the watchword. To me, this is a warning sign that any move back into cash could well produce outsized corrections in equities.
John Burford is the author of the definitive text on his trading method, Tramline Trading. He is also a freelance contributor and not a direct employee of interactive investor.
These articles are provided for information purposes only. Occasionally, an opinion about whether to buy or sell a specific investment may be provided by third parties. The content is not intended to be a personal recommendation to buy or sell any financial instrument or product, or to adopt any investment strategy as it is not provided based on an assessment of your investing knowledge and experience, your financial situation or your investment objectives. The value of your investments, and the income derived from them, may go down as well as up. You may not get back all the money that you invest. The investments referred to in this article may not be suitable for all investors, and if in doubt, an investor should seek advice from a qualified investment adviser.
Full performance can be found on the company or index summary page on the interactive investor website. Simply click on the company's or index name highlighted in the article.
Disclosure
We use a combination of fundamental and technical analysis in forming our view as to the valuation and prospects of an investment. Where relevant we have set out those particular matters we think are important in the above article, but further detail can be found here.
Please note that our article on this investment should not be considered to be a regular publication.
Details of all recommendations issued by ii during the previous 12-month period can be found here.
ii adheres to a strict code of conduct. Contributors may hold shares or have other interests in companies included in these portfolios, which could create a conflict of interests. Contributors intending to write about any financial instruments in which they have an interest are required to disclose such interest to ii and in the article itself. ii will at all times consider whether such interest impairs the objectivity of the recommendation.
In addition, individuals involved in the production of investment articles are subject to a personal account dealing restriction, which prevents them from placing a transaction in the specified instrument(s) for a period before and for five working days after such publication. This is to avoid personal interests conflicting with the interests of the recipients of those investment articles.