Chart of the week: should you buy ITM Power shares on this dip?
28th June 2021 10:45
by John Burford from interactive investor
This share has been one of the most popular on the stock market. Here's what our chartist thinks of prospects right now.

This UK company is at the forefront of the nascent hydrogen industry which is one of the hottest 'green' tech sectors today. Many have written about the processes involved but, as usual, my interest is in the charts – and sentiment.
ITM Power (LSE:ITM) is developing fuel cells for motive power but this is not a brand new revolutionary technology – it has been around a very long time. I even remember learning about hydrogen fuel cells in a chemistry class at school.
- 10 stocks that helped AIM be a world beater
- ITM Power: the hydrogen stock's CEO under the spotlight
- ITM Power: a star of the green investor revolution
For trading, liquidity is high and appears to be deep enough to qualify in my book as a candidate for trading and investing. It is listed on AIM.
- Invest with ii: Top UK Shares | Share Tips & Ideas | Open a Trading Account
Pre-January 2000 when the possibilities for producing and using hydrogen for motive power started entering the mainstream, the shares were trading peacefully around the 20p to 30p region, making it a true penny share going nowhere.
But then, the word gradually spread that maybe hydrogen is a fuel of the future (despite it being one of the oldest and the simplest atoms in the universe and powers our sun). Maybe it could be produced economically from the electrolysis of water after all.
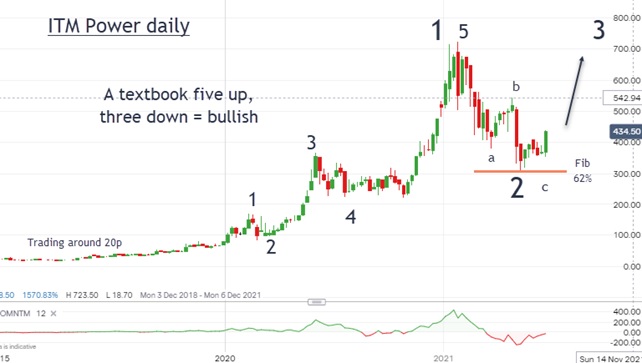
Last year, the shares rapidly advanced to 160p and then 360p, and then exploded to 720p in January in a series of five waves. But then, doubts as to the profit potential crept in and the shares plunged to a low of 310p in early May.
This is a typical course for a hot technology – boom and then bust (and sometimes boom again). The initial enthusiasm is invariably overdone and reality dawns in a Wile E. Coyote light-bulb moment.
The whole drama can be seen in my daily chart where I have marked my Elliott waves:
Past performance is not a guide to future performance.
The rally to the January high is in a clear five waves, and I have marked that wave 1 of a larger wave to come. Then, the correction occurred in three waves to the May deep low at 310p which is a precise Fibonacci 62% retrace of the entire rally off the pre-2020 lows. Seems like it was pre-ordained, doesn't it?
- Why reading charts can help you become a better investor
- Check out our award-winning stocks and shares ISA
In other words, this is an absolute textbook example of a five up, three down pattern to a Fib 62% retrace from where the advance can be revived.
With Friday's strong impulsive push up to 435p, odds are very high the bull has re-appeared. My first major target is the 'b' wave high around 550p and then on to the old high above 700p. Only an unexpected sharp decline below 300p would cancel out my forecast.
John Burford is the author of the definitive text on his trading method, Tramline Trading. He is also a freelance contributor and not a direct employee of interactive investor.
These articles are provided for information purposes only. Occasionally, an opinion about whether to buy or sell a specific investment may be provided by third parties. The content is not intended to be a personal recommendation to buy or sell any financial instrument or product, or to adopt any investment strategy as it is not provided based on an assessment of your investing knowledge and experience, your financial situation or your investment objectives. The value of your investments, and the income derived from them, may go down as well as up. You may not get back all the money that you invest. The investments referred to in this article may not be suitable for all investors, and if in doubt, an investor should seek advice from a qualified investment adviser.
Full performance can be found on the company or index summary page on the interactive investor website. Simply click on the company's or index name highlighted in the article.
Disclosure
We use a combination of fundamental and technical analysis in forming our view as to the valuation and prospects of an investment. Where relevant we have set out those particular matters we think are important in the above article, but further detail can be found here.
Please note that our article on this investment should not be considered to be a regular publication.
Details of all recommendations issued by ii during the previous 12-month period can be found here.
ii adheres to a strict code of conduct. Contributors may hold shares or have other interests in companies included in these portfolios, which could create a conflict of interests. Contributors intending to write about any financial instruments in which they have an interest are required to disclose such interest to ii and in the article itself. ii will at all times consider whether such interest impairs the objectivity of the recommendation.
In addition, individuals involved in the production of investment articles are subject to a personal account dealing restriction, which prevents them from placing a transaction in the specified instrument(s) for a period before and for five working days after such publication. This is to avoid personal interests conflicting with the interests of the recipients of those investment articles.