Chart of the week: A blue-chip poised for major rally
This trade is in the money, but could deliver significantly more, according to this analyst.
25th November 2019 12:46
by John Burford from interactive investor
This trade is in the money, but could deliver significantly more, according to this analyst.

BAT appears poised for major rally
I have been covering the progress of these shares since earlier this year in several COTWs in what I hope is a clear illustration in real time of how I use my Tramline methods to fish out potentially rewarding market moves – and how I handle the position as time passes.
My focus is generally on swing trades where I hope to capture a typical market move lasting anywhere from a week to a few months. But I believe this British American Tobacco (LSE:BATS) position will be more of a longer-term hold.
- A simple trade with high probability
- This winning trade could deliver again
- Bullish on this FTSE 100 high yielder
My emphasis is on precision timing of entries (and exits) where the risk of loss is judged to be low compared with the potential gain. This sets me aside from most analysts who claim it is impossible to pick tops and bottoms. You can be the judge of that.
Obviously, if you do have such a reliable timing (and correct direction) method, your profits are likely to be far larger than otherwise – and crucially your risks are lower as a bonus.
Here is the chart I posted in my COTW of September 30:
Source: interactive investor Past performance is not a guide to future performance
My original buy was just after the wave 5 low in the £26 area in my COTW of 28 January. That was prompted by a potentially complete five down to my lower tramline on a strong momentum divergence (red bar).
And following the first surge to the £32 area in April, the market entered a consolidation phase where the shares still remain inside – but are now showing initial signs of emerging from.
I mentioned last time that the nascent vaping sector is under pressure from the growing health concerns, and no less than Mr Trump has openly criticised the industry. That put some pressure on the shares last month but, crucially, no new lows were made, and BAT seems to have weathered that storm in a bullish show of strength.
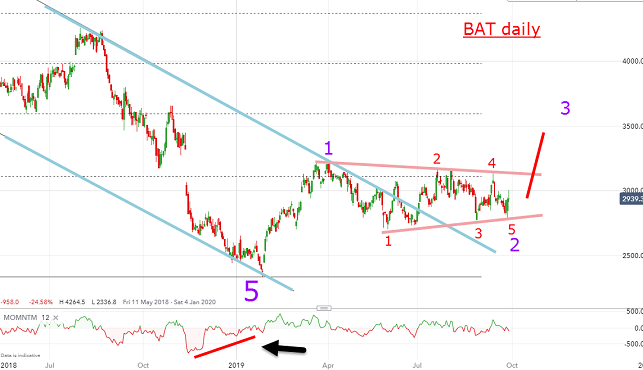
Here is the above chart updated:

Source: interactive investor Past performance is not a guide to future performance
I have slightly amended the position of my blue tramlines to better fit the highs/lows since 2017, and now I have not a pink wedge, as I suspected, but a small tramline pair with the parallel yellow line acting as the lower tramline. And I have amended my wave labels to accommodate recent price action. Remember, your wave labels are always subject to amends in real time.
Very conveniently, the final hit on that support on 22 October also planted a kiss on the upper blue tramline and is now engaged in a Scalded Cat Bounce up.
Recall that a Scalded Cat Bounce is a normal response to a tramline kiss. It is a sharp rejection of that price level. Sometimes, it requires two 'poisoned' kisses for the final rejection, as here.
So now, the shares are moving up towards the upper pink tramline, and a thrust above it would confirm my established outlook for a first target at £40 and then £40–£42.
In the accompanying video (available from tomorrow on interactive investor's YouTube page), I lay out my longer-term forecast.
For more information about Tramline Traders, or to take a three-week free trial, go to www.tramlinetraders.com.
John Burford is the author of the definitive text on his trading method, Tramline Trading. He is also a freelance contributor and not a direct employee of interactive investor.
These articles are provided for information purposes only. Occasionally, an opinion about whether to buy or sell a specific investment may be provided by third parties. The content is not intended to be a personal recommendation to buy or sell any financial instrument or product, or to adopt any investment strategy as it is not provided based on an assessment of your investing knowledge and experience, your financial situation or your investment objectives. The value of your investments, and the income derived from them, may go down as well as up. You may not get back all the money that you invest. The investments referred to in this article may not be suitable for all investors, and if in doubt, an investor should seek advice from a qualified investment adviser.
Full performance can be found on the company or index summary page on the interactive investor website. Simply click on the company's or index name highlighted in the article.
Disclosure
We use a combination of fundamental and technical analysis in forming our view as to the valuation and prospects of an investment. Where relevant we have set out those particular matters we think are important in the above article, but further detail can be found here.
Please note that our article on this investment should not be considered to be a regular publication.
Details of all recommendations issued by ii during the previous 12-month period can be found here.
ii adheres to a strict code of conduct. Contributors may hold shares or have other interests in companies included in these portfolios, which could create a conflict of interests. Contributors intending to write about any financial instruments in which they have an interest are required to disclose such interest to ii and in the article itself. ii will at all times consider whether such interest impairs the objectivity of the recommendation.
In addition, individuals involved in the production of investment articles are subject to a personal account dealing restriction, which prevents them from placing a transaction in the specified instrument(s) for a period before and for five working days after such publication. This is to avoid personal interests conflicting with the interests of the recipients of those investment articles.