Chart of the week: buy, hold or sell this tech darling?
22nd August 2022 13:32
by John Burford from interactive investor
Technical analyst John Burford makes the case for taking profits in this US share, which investors have chased up with extreme bullish fervour.

Last week, I argued my case for taking profits in Apple (NASDAQ:AAPL) prior to what I believe will be a lengthy bear trend. For those who can short equities, that notion was also appropriate of course. And today I am making a similar case for Tesla Inc (NASDAQ:TSLA), another big-tech darling that investors have chased up with such extreme bullish fervour.
Since I started writing my Chart of the week articles for interactive investor, I have attempted to counter the widely held notion that buying into a strong bull trend is a sensible strategy. I have offered example after example of shares that topped out just when bullish mania had reached a peak (usually on a ‘bullish’ report).
- Discover more: Buy international shares | Interactive investor Offers | Most-traded US stocks
In fact, the most sensible strategy for generating profits has been to take at least some profits on price surges. Of course, accurate timing plays a major role and for that I use my Tramline methods.
Most investors have been exceedingly bullish on Tesla for some time as they see the EV future is very bright. I am not so sure and have remained deeply sceptical that fossil fuels will be totally replaced by electrons.
For one thing, I see huge challenges in being able to extract the sheer mass of the necessary metals needed. Just one of them – lithium – is in short supply with high prices, which is making EVs more expensive and putting them even more out of the reach of most.
Much lithium processing is in China’s hands, which is extremely unhealthy from our perspective.
But as usual, I am putting the horse before the cart and projecting the future for Tesla (and EVs) by analysing the chart patterns first. Most analysts do it the other way around and project the future for the company and then forecast the share price movements from it.
Past performance is not a guide to future performance.
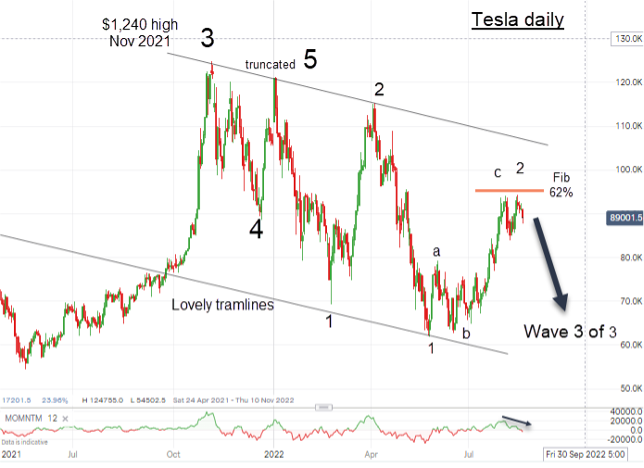
This is quite an unusual chart – and not easy to analyse! I have the major wave 3 high (following a long and strong rally phase) at $1,240 in November. This was the period when all the major US share indices made their all-time highs as bullish mania flared out in a buying climax.
Since then, the price has traced out a series of wide swings. From that high, I have wave 4 as a clear three down (textbook) leading to a high at $1210 just below the wave 3 high. From there, it plunged to a new low at $70. That $1210 high I have labelled as a 'truncated wave 5' – a very rare pattern.
Most fifth waves move beyond the third wave, but not this one. And this truncation of wave 5 implies that the bull forces were not strong enough to reach above $1240 – a bearish omen.
- 10 high-quality tech shares that might be on sale
- Ian Cowie: why I’d rather buy the tech dip than sell
And now I can draw an impressive tramline pair joining the highs and lows.
Last week's rally took the price to the Fib 62% retrace on a good momentum divergence, which I have as the top of wave ‘c’ of 2.
Provided that high can hold, the shares will be on one of the most destructive bear phases in a wave 3 of 3 down. That level at $950 is now my line in the sand.
My first major target is $850 and then $600. Only a sharp move above $950 would force me back to the drawing board.
John Burford is a freelance contributor and not a direct employee of interactive investor.
These articles are provided for information purposes only. Occasionally, an opinion about whether to buy or sell a specific investment may be provided by third parties. The content is not intended to be a personal recommendation to buy or sell any financial instrument or product, or to adopt any investment strategy as it is not provided based on an assessment of your investing knowledge and experience, your financial situation or your investment objectives. The value of your investments, and the income derived from them, may go down as well as up. You may not get back all the money that you invest. The investments referred to in this article may not be suitable for all investors, and if in doubt, an investor should seek advice from a qualified investment adviser.
Full performance can be found on the company or index summary page on the interactive investor website. Simply click on the company's or index name highlighted in the article.
Disclosure
We use a combination of fundamental and technical analysis in forming our view as to the valuation and prospects of an investment. Where relevant we have set out those particular matters we think are important in the above article, but further detail can be found here.
Please note that our article on this investment should not be considered to be a regular publication.
Details of all recommendations issued by ii during the previous 12-month period can be found here.
ii adheres to a strict code of conduct. Contributors may hold shares or have other interests in companies included in these portfolios, which could create a conflict of interests. Contributors intending to write about any financial instruments in which they have an interest are required to disclose such interest to ii and in the article itself. ii will at all times consider whether such interest impairs the objectivity of the recommendation.
In addition, individuals involved in the production of investment articles are subject to a personal account dealing restriction, which prevents them from placing a transaction in the specified instrument(s) for a period before and for five working days after such publication. This is to avoid personal interests conflicting with the interests of the recipients of those investment articles.