Chart of the week: can Facebook withstand the President’s ire?
Our expert examines one of the world’s biggest tech giants.
19th July 2021 14:58
by John Burford from interactive investor
Our expert examines one of the world’s biggest tech giants and asks whether it is now entering a bear phase.

It is a brave (or foolish) analyst who dares to suggest that one of the juggernauts of the great tech bull market may have reached a major reversal point.
After all, it made a new all-time high a few days ago. But just as no tree forever grows to the sky (or much less hits the moon), no share advances forever.
I believe there is no other valid method of judging the limits of bull (or bear) markets than technical analysis using time-proven concepts with the caveat that no forecast – by whatever means it is derived – can be 100% secure.
We all try to use the best data available at the time – and the data can change.
So, with that in mind, I am venturing into the contrarian world (again) and putting my case that Facebook (NASDAQ:FB) shares are likely topping and investors who take at least some profits here would be prudent.
- Why reading charts can help you become a better investor
- Six things you must do before buying any share
- Discover how to be a better investor here
Social media has been a great success story with advertising revenue riding on the back of that popular trend.
But there is a dark side to that success which has been growing under the surface – and that is the inability of the company to rein in the hate that proliferates the sites. Regulators have tried to force them to clean up their act to little avail so far.
But when the US president himself jumps in with a comment that Facebook is “killing people with Covid misinformation”, as he did last week, has a watershed event occurred?
Accusing a major company of killing people is not an everyday event. So, have the authorities finally decided that enough is enough? Will advertisers now begin to distance themselves from such a negative societal influence?
Let's get to the charts. Here is the weekly for the big picture:
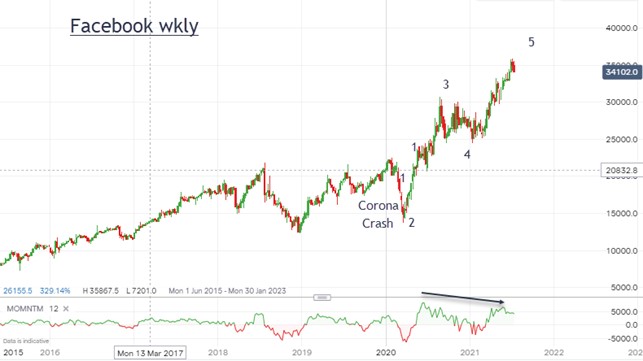
Past performance is not a guide to future performance.
To me, the most remarkable feature is the strongest-ever advance following the corona crash in March 2020.
The strongest surge has occurred in the last four months with the slope at a very high angle. But as the share price advanced into last week's $358 high, momentum lagged.
That is not a good sign for further bullish action. Also, I have an Elliott wave count pointing to the late stages of a fifth wave where termination would result in a pullback that could develop into a larger bear phase.
Here is a close-up on the daily:
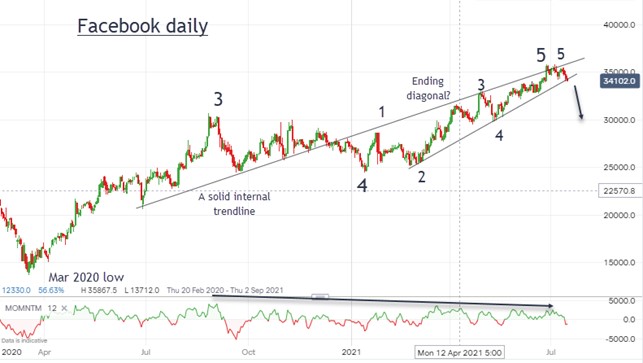
Past performance is not a guide to future performance.
Several features are noteworthy. First, I have a solid internal trendline that catches all of the highs and lows from last July with highly accurate touches.
I believe this line is very significant as a line of support/resistance. Second, I have a potential 'ending diagonal' wedge pattern with five clear waves and a budding momentum divergence.
- Chart of the week: are Apple shares about to race past record high?
- Check out our award-winning stocks and shares ISA
This pattern is commonly seen as the finishing flourish to a sustained bull (and bear) run.
And, of course, there is the certainty that quantitative easing (QE) will not be with us forever and one of the props for Wall Street will be kicked away. By the time that news hits the wires, stocks would very likely be much lower in anticipation.
If I am correct, I expect the shares to enter a bear phase with my first target around the $300 region with lower potential thereafter.
Only a strong surge up above $360 would send me back to the drawing board.
John Burford is the author of the definitive text on his trading method, Tramline Trading. He is also a freelance contributor and not a direct employee of interactive investor.
These articles are provided for information purposes only. Occasionally, an opinion about whether to buy or sell a specific investment may be provided by third parties. The content is not intended to be a personal recommendation to buy or sell any financial instrument or product, or to adopt any investment strategy as it is not provided based on an assessment of your investing knowledge and experience, your financial situation or your investment objectives. The value of your investments, and the income derived from them, may go down as well as up. You may not get back all the money that you invest. The investments referred to in this article may not be suitable for all investors, and if in doubt, an investor should seek advice from a qualified investment adviser.
Full performance can be found on the company or index summary page on the interactive investor website. Simply click on the company's or index name highlighted in the article.
Disclosure
We use a combination of fundamental and technical analysis in forming our view as to the valuation and prospects of an investment. Where relevant we have set out those particular matters we think are important in the above article, but further detail can be found here.
Please note that our article on this investment should not be considered to be a regular publication.
Details of all recommendations issued by ii during the previous 12-month period can be found here.
ii adheres to a strict code of conduct. Contributors may hold shares or have other interests in companies included in these portfolios, which could create a conflict of interests. Contributors intending to write about any financial instruments in which they have an interest are required to disclose such interest to ii and in the article itself. ii will at all times consider whether such interest impairs the objectivity of the recommendation.
In addition, individuals involved in the production of investment articles are subject to a personal account dealing restriction, which prevents them from placing a transaction in the specified instrument(s) for a period before and for five working days after such publication. This is to avoid personal interests conflicting with the interests of the recipients of those investment articles.