Commodities outlook: Has oil found support?
It's not just the US president that continues to exert influence over commodity prices.
12th June 2019 11:02
by Rajan Dhall from interactive investor
It's not just the US president that continues to exert influence over commodity prices.
It's been a strange week so far for commodities, and one which looked so rosy at the start!
Over the weekend, US President Trump patched things up with Mexico and cancelled the proposed tariffs due to be enforced last Friday. The deal got done after agreeing a fix for Mexico's lax immigration policy.
Markets rejoiced at the prospect of a more cooperative US president, and all was well and good with the world…until yesterday, when Trump stated the cards were in his hands in negotiations with China, and that there may not be a deal at all.
Equity indices sold off along with base metals at the prospect of more issues with China. Both should be at the G20 meeting this month, and Trump has warned that if the Chinese leader does not attend, the next round of tariffs will be enacted.
Right call on copper
In copper markets, I am happy to report that the technicals we reported on last week worked a treat. The price stopped exactly at the trendline on the weekly chart and moved higher following news that China may relax laws on key infrastructure projects.
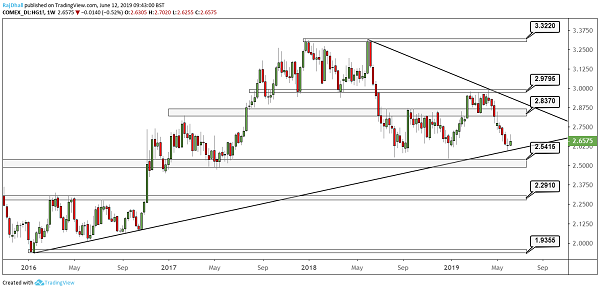
Source: TradingView Past performance is not a guide to future performance
Now we need to see if the special measures make a difference to purchasing data set for release next month. Massive amounts of Chinese stimulus pumped into the market must surely filter through at some point.
The market narrative remains fixated on the US-China trade deal.
Will oil demand weaken?
Once again, oil bulls were disappointed with figures from the American Petroleum Institute (API) released overnight, which showed another build in inventory levels.
We also received new forecasts from the US Energy Information Administration (EIA), who now expect global oil demand to rise by 1.2 million barrels per day (b/d) this year, which is 200,000 b/d lower than the May forecast.
EIA also expects demand in 2020 to increase by 1.4 million b/d, about 100,000 b/d lower than the previous forecast. All in all, not great news.
OPEC + members have been commenting on the situation, with Russia saying it will adhere to the agreements set out in the last OPEC+ summit. If prices continue to fall it would be fair to assume the cuts could be extended, but the question remains if any country actually wants them to be deeper.
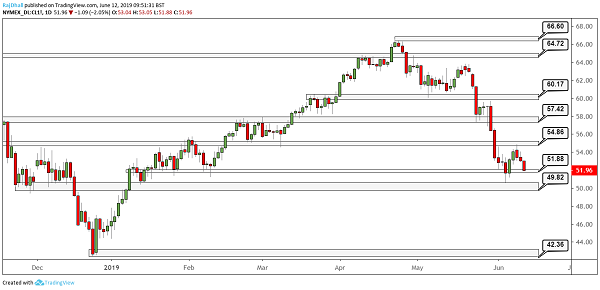
Source: TradingView Past performance is not a guide to future performance
The oil chart still looks bearish, but we need to see a 'downside rejection', and the psychological $50 per barrel level could be the big number. Last week's so-called hammer candle* seems to have provided some support, and the low at $50.60 per barrel now becomes an important level to watch.
On the upside, $54.86 per barrel could keep a lid on things but, if we get a break, it would be a strong indication that we are done with the downside and a base could be in place.
*A 'Hammer' candlestick is a term used by technical analysts to describe a specific chart formation. It forms when a share or other instrument falls sharply after the market opens, but ends the day much higher than the low. It looks like a lollipop, or a hammer.
These articles are provided for information purposes only. Occasionally, an opinion about whether to buy or sell a specific investment may be provided by third parties. The content is not intended to be a personal recommendation to buy or sell any financial instrument or product, or to adopt any investment strategy as it is not provided based on an assessment of your investing knowledge and experience, your financial situation or your investment objectives. The value of your investments, and the income derived from them, may go down as well as up. You may not get back all the money that you invest. The investments referred to in this article may not be suitable for all investors, and if in doubt, an investor should seek advice from a qualified investment adviser.
Full performance can be found on the company or index summary page on the interactive investor website. Simply click on the company's or index name highlighted in the article.